Figures & data
Figure 1. A set of experiments designed to show the effects of WEPA on breast tumour growth. Day 1 to Day 7 were time points for gavage. Day 8 was the time point for 4T1 cell transplantation. Day 15 (Week 1) to Day 36 (Week 4) are time points for collection of peripheral blood samples after 4T1 cell transplantation.
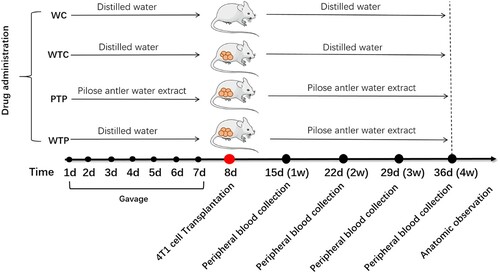
Figure 2. The states of tumours in tumor-bearing mice treated with or without WEPA. (a) shows the growth curves of tumours under different treatments. Error bars represent means ± standard deviations (n = 10). (b) the representative photograph shows the tumours under different treatments.
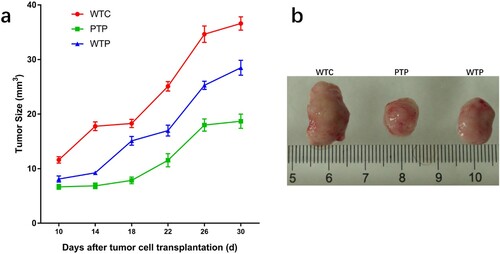
Figure 3. The states of spleens in tumor-bearing mice treated with or without WEPA. (a) shows the spleen index of different treatments. Spleen index (mg/10 g) = (Spleen weight/Mice weight) × 10. (b) the representative photograph shows the spleens under different treatments. Error bars represent means ± standard deviations (n = 10), *P < 0.05, **P < 0.01.
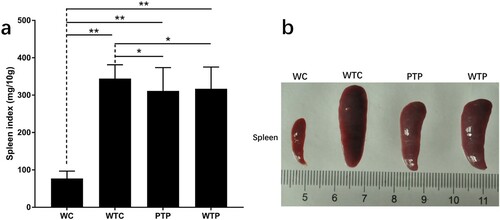
Figure 4. The levels of CD4+ T cells and CD8+ T cells from tumor-bearing mice treated with or without WEPA. (a) shows the representative flow cytometry plots of CD4+ T cells and CD8+ T cells; (b) and (c) show the levels of CD4+ T cells and CD8+ T cells under different treatments, respectively. Error bars represent means ± standard deviations (n = 10), *P < 0.05, **P < 0.01.
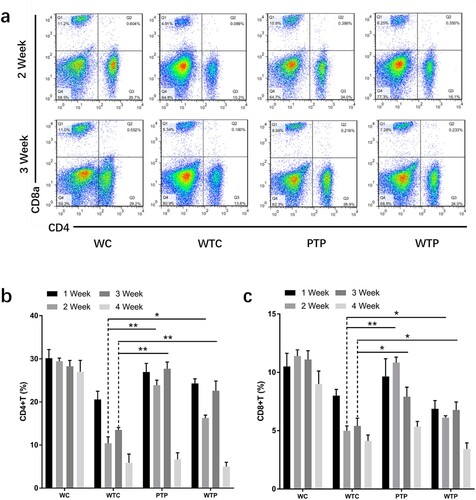
Figure 5. The levels of NK cells and MDSCs from tumor-bearing mice treated with or without WEPA. (a) and (b) show the levels of NK cells and MDSCs under different treatments, respectively. Error bars represent means ± standard deviations (n = 10), *P < 0.05, **P < 0.01.
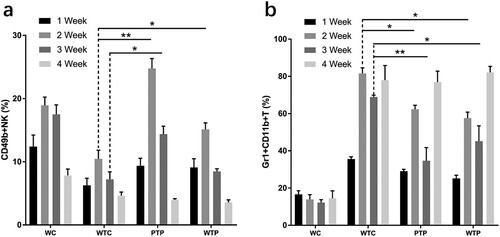
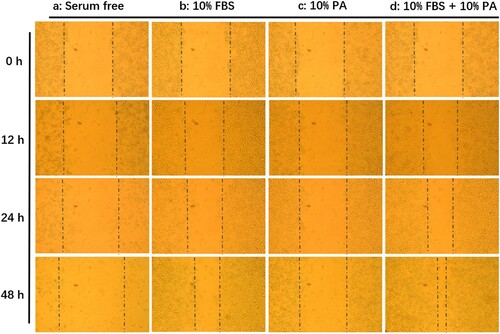
Figure 6. Effects of pilose antler water extract gavage on proliferation and migration of 4T1 breast cancer cells in vitro. (a), (b), (c), (d) show 4T1 cells cultured in RPMI-1640 supplemented without FBS, with 10% FBS, with 10% WEPA, and with 10% FBS & 10% WEPA, respectively.