Figures & data
Table 1. Primer sequences for real-time PCR.
Figure 1. The effect of ZEA on the intestinal mucosal morphology of the jejunum in BALB/C mice. A: The jejunum of the CON group. B: The jejunum of the ZEA group.
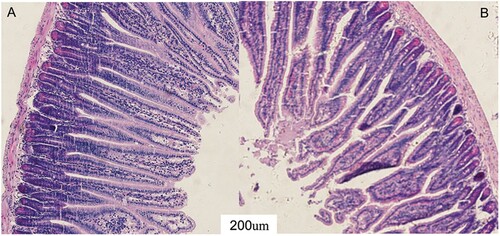
Figure 2. A: Changes in the immune gene expression in the jejunum mucosa of the mice. B: Changes in the IgA levels in the jejunum faeces. All the data are expressed as the means ± SEM. *: P value < 0.05, **: P value < 0.01, ***: P value < 0.001.
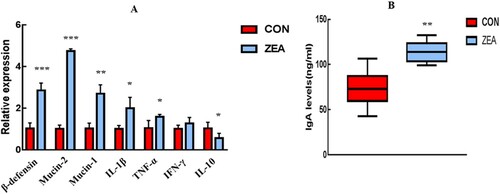
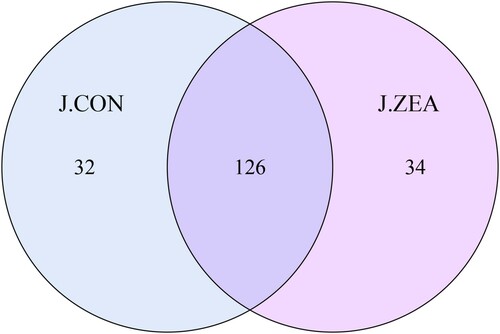
Figure 3. Effect of ZEA on the intestinal microflora. Comparison of OTU.