Figures & data
Figure 1. Expression vector pBV220–scFv–phoA.
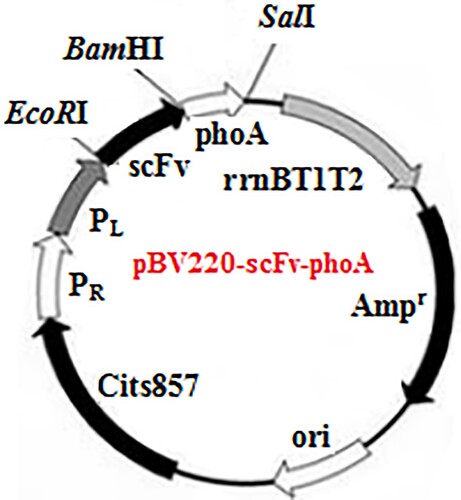
Figure 2. Agarose gel electrophoresis of VH, VL, and scFv genes. (A) PCR amplification of VH and VL. Lane M, DNA marker 2000. Lane 1, VL gene. Lane 2, VH gene. (B) PCR amplification of scFv gene. Lane M, DNA marker 2000. Lane 1, scFv gene.
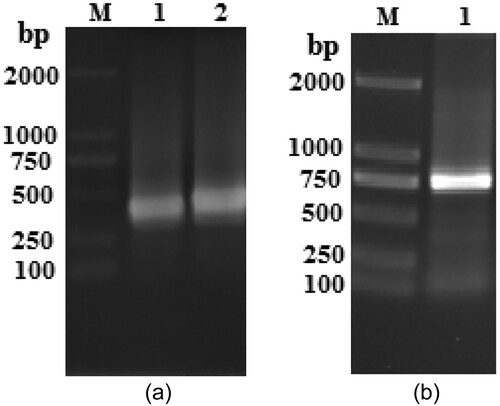
Figure 3. The recombinant plasmid pBV220–scFv–phoA identification using PCR and the digestion on agarose gel electrophoresis. Lane M1, DNA Marker 2000; lane M2, k-HindIII digest DNA Marker 23130; lane 1, purification phoA gene; lane 2, BamHI and SalI digestion product of plasmid pBV220–scFv–phoA; lane 3, PCR product of plasmid pBV220–scFv–phoA; lane 4, BamHI digestion product of plasmid pBV220–scFv–phoA; lane 5, SalI digestion product of plasmid pBV220–scFv–phoA.
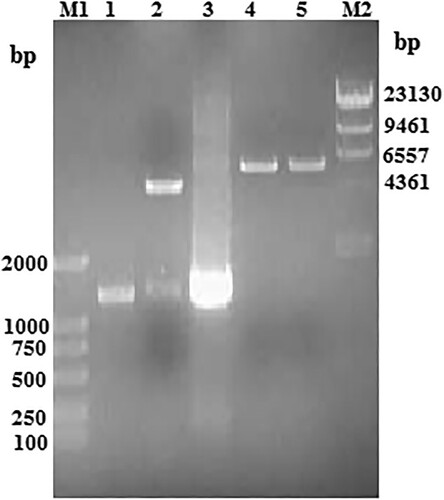
Figure 4. SDS-PAGE analysis of the expressed products. Lane M, marker 116 kDa. Lane 1, after the induction. Lane 2, purified scFv–AP fusion protein.
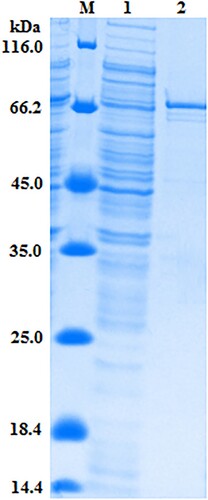
Figure 5. AMP standard curves obtained obtained with the scFv–AP fusion protein in ic-CLEIA and ic-ELISA under optimized conditions (n = 3).
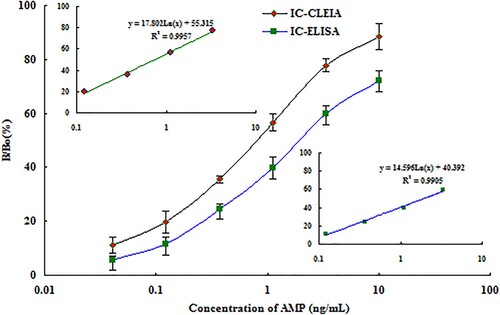
Table 1. Cross-reactivity of the scFv–AP fusion protein with other AMP analogs using ic-CLEIA.
Table 2. Recovery of AMP from spiked milk samples using method of ic-CLEIA (n = 3).
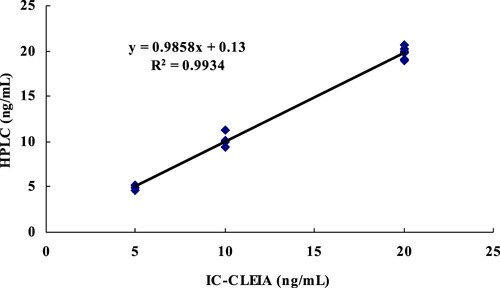
Figure 6. Correlation between ic-CLEIA and HPLC results for milk spiked with AMP at three levels, (R2 = 0.9934, n = 6).