Figures & data
Figure 1. Chemical structures of flunixin and 5-hydroxyflunixin.
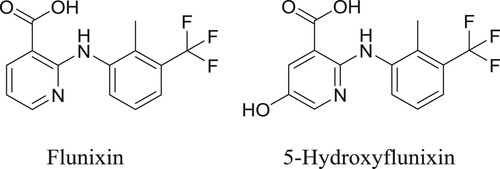
Table 1. The MRLs set by different countries for flunixin residues in foods of animal origin.
Table 2. Optimisation of dilutions for coating antigen and antibody using checkerboard titration. The data shown in the table are absorbance values.
Figure 2. Effects of pH (A), ionic strength (B) of assay buffer, and acetonitrile tolerance (C) on the assay performance of icELISA.
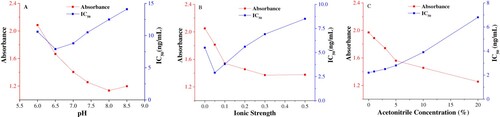
Figure 3. Calibration curves of icELISA for flunixin and 5-hydroxyflunixin residue analysis. The data are average values of triplicate samples (average ± SD).
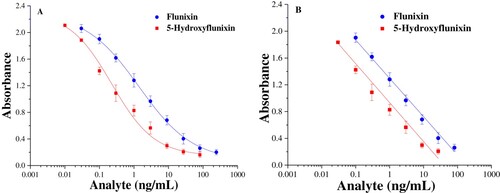
Table 3. IC50 and cross-reactivity values using 5-hydroxyflunixin as a standard.
Figure 4. Evaluation of matrix effects of bovine muscle (A) and milk (B) on the calibration curves. Extract efficiency (C) from acidified incurred samples were calculated as the percentage of results obtained with the assay buffer.
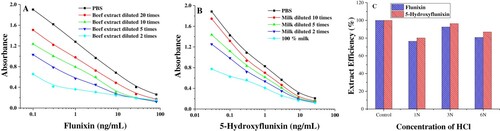
Table 4. Average recovery and CV values for flunixin and 5-hydroxyflunixin detection in bovine muscle and milk (n = 3).
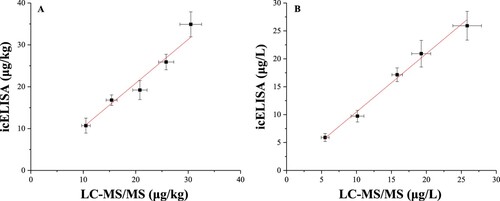
Figure 5. Correlation between icELISA and LC-MS/MS in detecting flunixin residues in bovine muscle (A) and 5-hydroxyflunixin residues in milk (B). The data are average values of triplicate samples (average ± SD).