Figures & data
Figure 1. (A) Chemical structure of astilbin. (B) The writhing and stretching times of mice within 15 min in acetic acid-induced writhing test. (C) The latency period of each mouse on the hot plate was recorded at 30 min, 60 min and 90 min after agents treatment. (D) The period of licking paws of each mouse were recorded in formalin test at the first phase (0–5 min) and the second phase (15–30 min). Results were expressed as mean ± S.E.M. (n = 12). *P < 0.05, **P < 0.01 and ***P < 0.001 versus control mice.
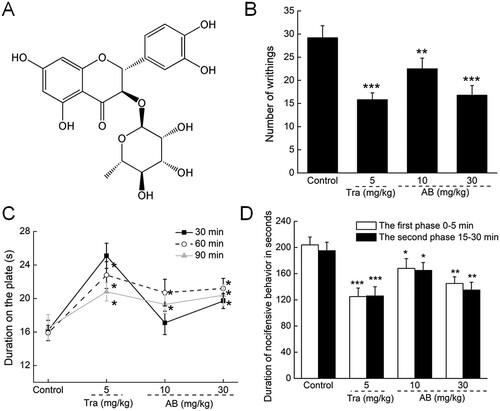
Figure 2. The levels of (A) nNOS, (B) 5-HT and (C) NE in serum, and the levels of (D) nNOS, (E) 5-HT and (F) NE in brain tissues were analysed before and after 30-s thermal stimulus of mice received 18-day AB and Tra administration. Data were expressed as mean ± S.E.M. (n = 12). *P < 0.05 and **P < 0.01 versus control mice.
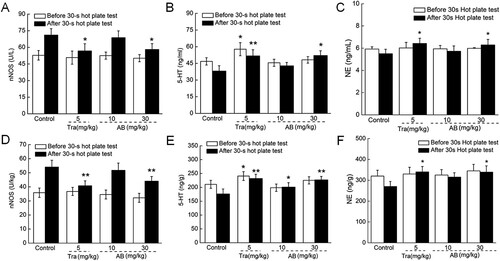
Table 1. The influences of six chosen antagonist on the analgesic efficacies of AB in hot plate test.
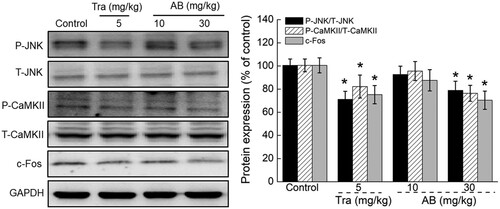
Figure 3. The effects of AB and Tra on the expression levels of P-JNK, P-CaMKII and c-Fos in brains of mice received 30-s thermal stimulus. Quantification data of the expression of P-JNK and P-CaMKII were normalized by corresponding T-JNK and T-CaMKII respectively, and the expression of c-Fos were normalized by GAPDH. Data were expressed as mean ± S.E.D. (n = 6). *P < 0.05 versus control mice.