Figures & data
Table 1. Comparison of the proposed assay with reported methods for imidacloprid detection.
Figure 1. Schematic of preparation of nanocapsule probe and the probe-based assay procedure. (A) Synthesis illustration of nanocapsule probe and (B) protocol of the enhanced assay. (a) Coating antigen (0.25 μg mL−1, 100 µL) was added to 96-well plate and incubated 2 h at 37°C. (b) Imidacloprid (100 µL) and mAb (0.125 μg mL−1, 100 µL) were added and incubated 1 h at 37°C. (c) The probe (100 µL) was added and incubated 1 h at 37°C. (d) Substrate solution (100 µL) was added and incubated 15 min at 37°C.
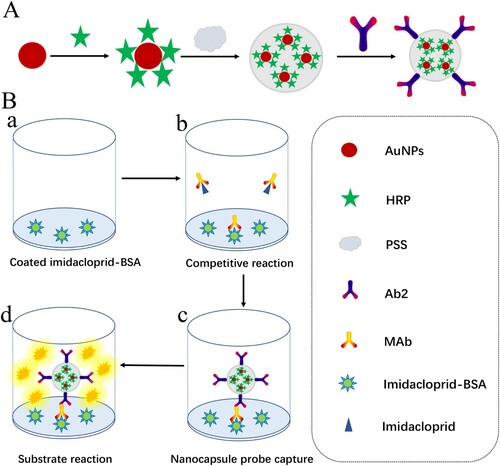
Figure 2. Synthesis confirmation of nanocapsule probe. (A) TEM images of the AuNPs (a) and the synthesized nanocapsule probe (b). (B) UV-spectra analysis of synthesis process of nanocapsule: AuNPs (a); AuNPs-HRP (b); AuNPs-HRP-PSS (c); AuNPs-HRP-PSS-Ab2 (d). (C) The relationship between the amount of Ab2 and the absorbance value. P/N value is the positive OD value/blank OD value.
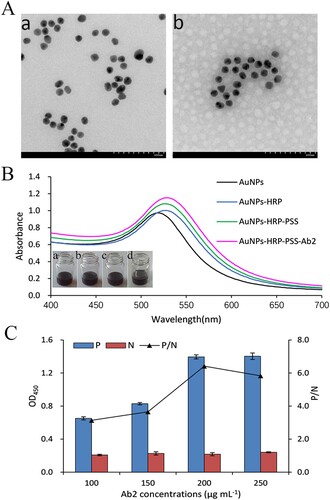
Figure 3. Standard curve of nanocapsule probe-based assay for imidacloprid. The curve was obtained by using the relationship between the values of inhibition and the logarithm of the concentrations of imidacloprid. Results are mean ± SD (n = 3).
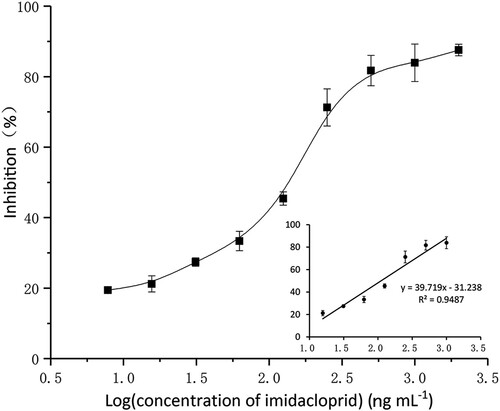
Table 2. Cross-reactivity (CR) of the probe with imidacloprid and its analogues.
Table 3. Recovery of spiked samples.
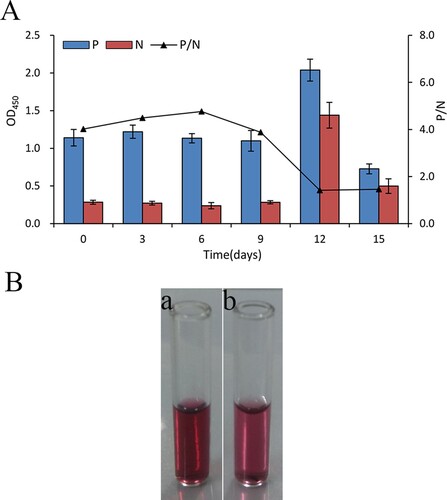
Figure 4. (A) OD450 value of assay for the nanocapsule probe stored for different time-periods. (B) The picture of the probe stored at 0 (a), 12 (b) days.