
Figures & data
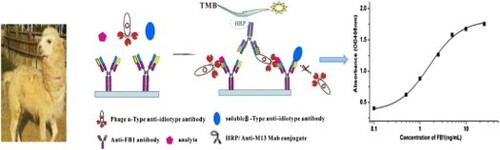
Figure 1. Schematic diagram of the noncompetitive idiometric nanobodies phage ELISA.
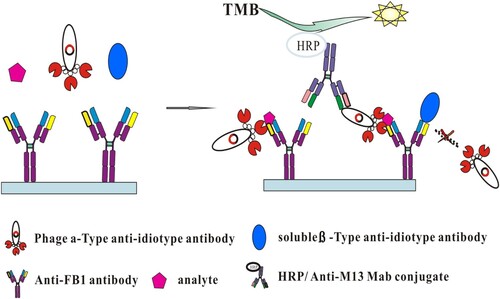
Figure 2. (a) Phage ELISA results with several single clones towards 3F11 with 50 ng/mL FB1 (red column), without FB1 (black column) or BSA (slash column). (b) Noncompetitive idiometric nanobodies phage ELISA for FB1 set up with different phage Ab2α. Data are reported as an average ± standard error.
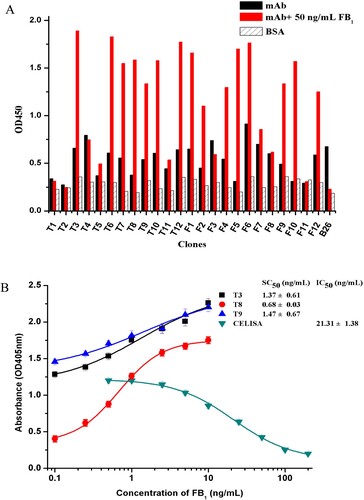
Figure 3. (a) Cross-reactivity of the noncompetitive idiometric nanobodies phage ELISA with other mycotoxins. (b) Cross-reactivity of the noncompetitive idiometric nanobodies phage ELISA with primary antibodies and mycotoxins.
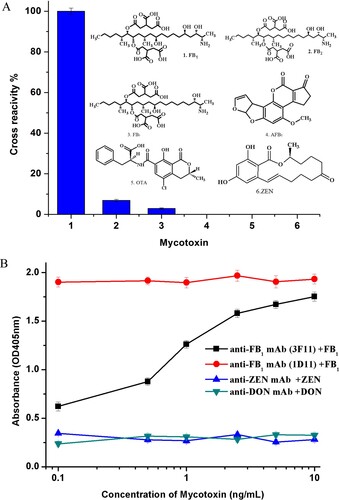
Figure 4. Calibration curves of FB1 in PBS and in sample extracts of different dilutions with or without solid phase extraction.
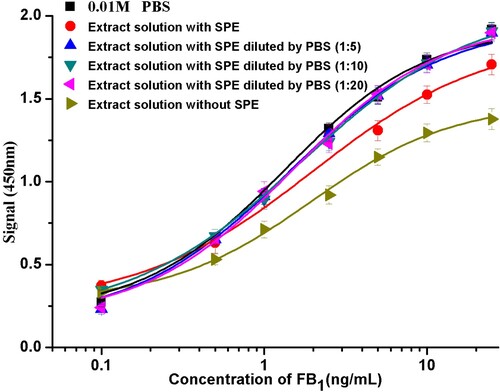
Table 1. Recoveries of FB1 from the spiked corn samples by the noncompetitive idiometric nanobodies phage ELISA.
Table 2. Analysis results of the cereal samples by the noncompetitive idiometric nanobodies phage ELISA and LC–MS/MS.
Supplemental material