Figures & data
Figure 1. Chemical structures of the three anilinopyrimidine fungicides (pyrimethanil, cyprodinil and mepanipyrim) and of the three pyrimethanil haptens (pMm, pMn and pMp).
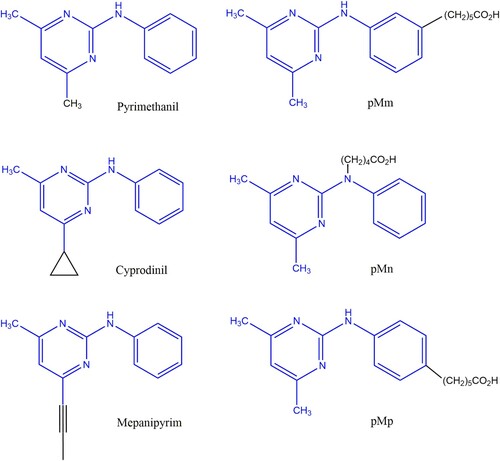
Figure 2. Synthesis route of pMm, N-succinimidyl ester of hapten pMm, pMm-BSA, pMm-HSA and pMm-OVA.
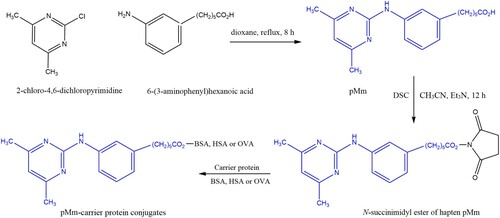
Table 1. Titre and specificity of the immunized mice.
Table 2. The titre of each monoclonal antibody, and its sensitivity to pyrimethanil.
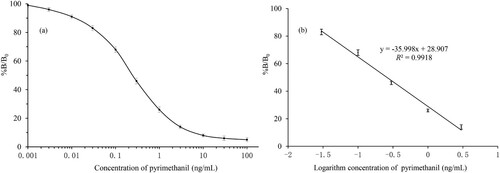
Figure 3. The standard curve for pyrimethanil using ic-ELISA: (a) typical best fit calibration curves of the ic-ELISA with pyrimethanil concentration range from 0.001 to 100 ng/mL and (b) the linearity was good from 0.03 to 3 ng/mL which has a linear regression equation and acceptable correlation (R2). Note that B and B0 are the absorbance of samples with and without pyrimethanil, respectively (n = 5).