Figures & data
Figure 1. Schematic illustration of the LFIA for the detection of ADAs.
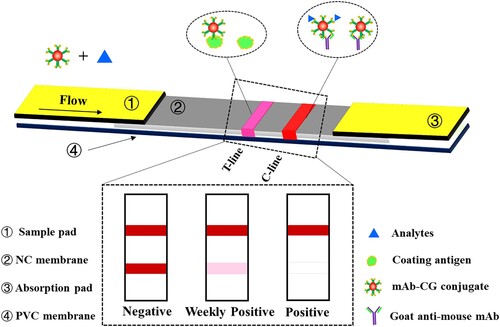
Figure 2. The synthetic schemes of haptens for AMA. (a) The hapten (AMA-hapten) was synthesized by a nucleophilic substitution reaction. (b) The hapten (RMA-hapten) was synthesized by a succinic anhydride method.
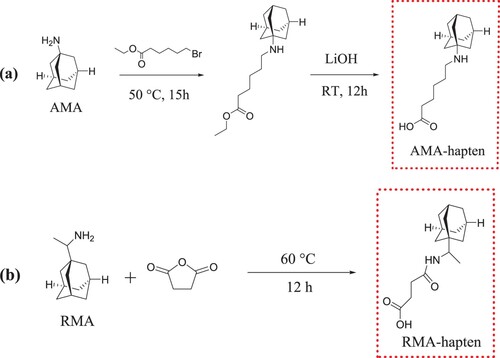
Figure 3. LC–MS analysis of haptens of ADAs. (a) The liquid chromatogram spectrum of AMA-hapten; (b) the mass spectrum of AMA-hapten; (c) The liquid chromatogram spectrum of RMA-hapten; (d) the mass spectrum of RMA-hapten.
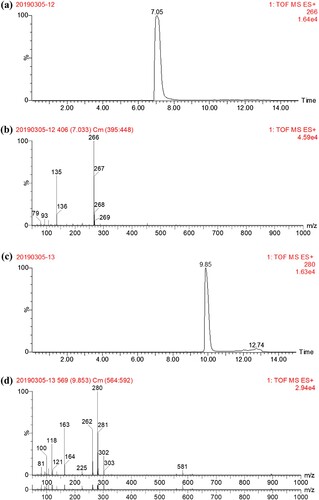
Table 1. Titre and specficity of the immunized mice.a
Figure 4. Characterization of the mAb against ADAs. (a) Isotype determination of the anti-ADAs mAb. (b) Affinity testing results of the antibody.
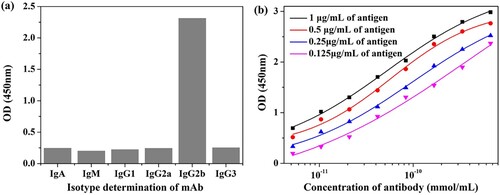
Table 2. The characterization of anti-ADAs mAb.
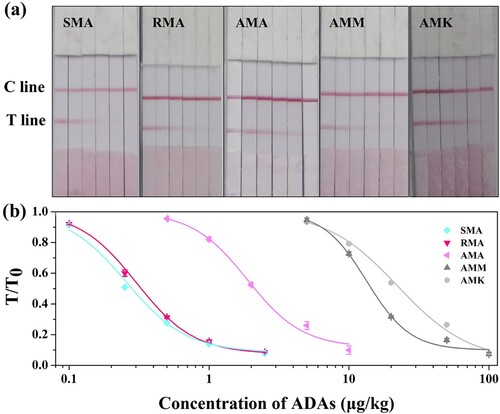
Figure 5. The test results of ADAs with LFIA. (a) Qualitative detection of ADAs in chicken samples (SMA: 0, 0.1, 0.25, 0.5, 1, 2.5 μg/kg; RMA: 0, 0.1, 0.25, 0.5, 1, 2.5 μg/kg; AMA: 0, 0.5, 1, 2, 5, 10 μg/mL; AMM: 0, 5, 10, 20, 50, 100 μg/kg; AMK: 0, 5, 10, 20, 50, 100 μg/kg); (b) Standard curves for detecting chicken samples using LFIA. The X-axis is shown as the logarithmic concentrations of ADAs; and T/T0 defined as the ratio of the colour density of the spiked sample to that of the blank sample.