Figures & data
Table 1. Urease activity after anti-urease IgY treatment.
Figure 1. Confirmation of recombinant protein expression (UreA). Notes: Results of SDS-PAGE and western-blot analysis of Urease A. pET32a-UreaseA: 51 kDa. SDS-PAGE, Lane 1,3- Before induction; 2,4- Before induction.
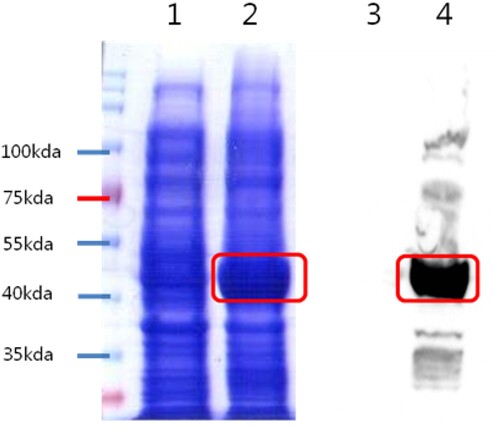
Figure 2. Confirmation of recombinant protein expression (UreB). Notes: Results of SDS-PAGE and Western-blot analysis of Urease B protein. pET32a-UreaseB 81 kDa. SDS-PAGE, Lane 1,3- Before IPGT induction; 2,4- After IIPGT induction.
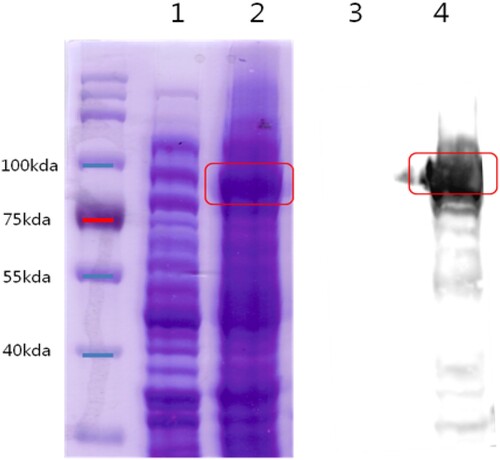
Figure 3. Detection of egg yolk antibody. Notes: Results of egg yolk antibody detection test by 12% SDS-PAGE.
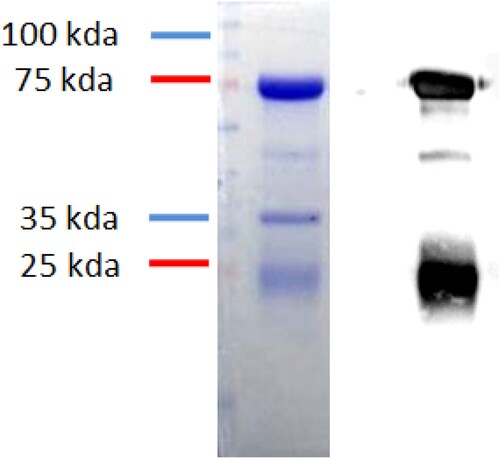
Figure 4. Binding identification test for anti-bacteria. Notes: Binding affinity test for egg yolk antibody by 12% SDS-PAGE. M: Protein Marker, 1: H. pylori protein, 2: Anti-H against H. pylori. H. pylori-IgY Binding affinity was confirmed by western-blot.
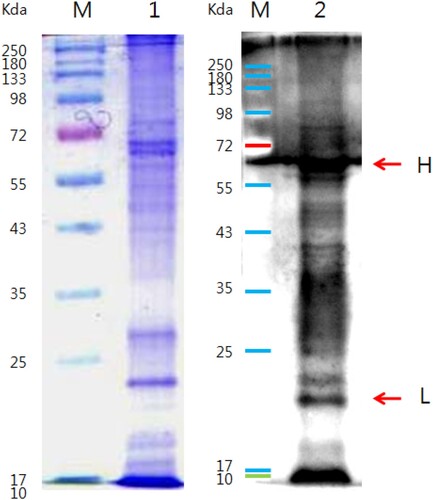
Figure 5. Coagulation reaction confirmation test result. Notes: Cohesion test results. IgY sample 40 mg/ml starting, 2-fold dilution, optical microscopy at 200× magnification.
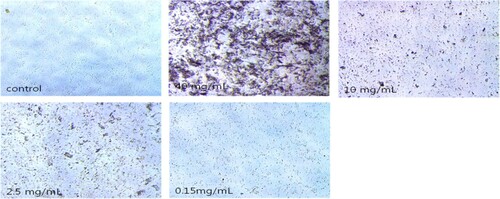
Table 2. Test results for coagulation by IgY concentration.
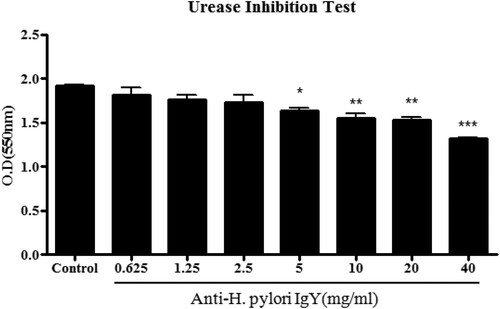
Figure 6. Urease inhibition result. Notes: Urease activity inhibition confirmation test results. *p < 0.05, **p < 0.01, ***p < 0.001 vs control.