Figures & data
Table 1. Composition of experimental diets (g/kg).
Table 2. Primers used for real-time RT-PCR.
Figure 1. Weights of liver, epididymal fat, intestinal fat, perirenal fat, total fat weight and fat ratio of ICR mice in each group. Values are expressed as mean ± S.D; Within the same bar, means with different letters (a or b) are significantly different at p < 0.05 by Duncan’s multiple range test.
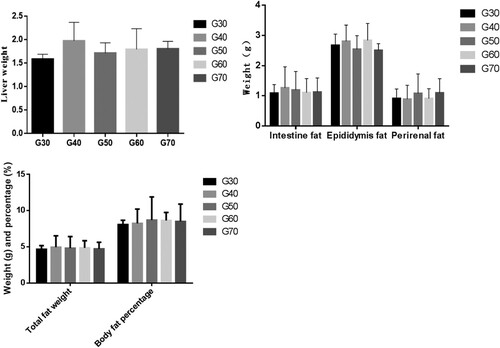
Figure 2. The serum levels of fasting blood glucose, insulin and glucagon of ICR mice in each group. Values are expressed as mean ± S.D; Within the same bar, means with different letters (a or b) are significantly different at p < 0.05 by Duncan’s multiple range test.
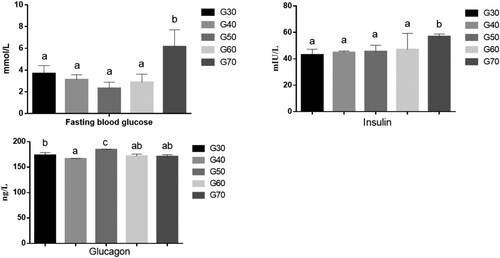
Figure 3. The serum levels of TG, TC, HDL-C, LDL-C, FFA and TNF- of ICR mice in each group. Values are expressed as mean ± S.D; Within the same bar, means with different letters (a or b) are significantly different at p < 0.05 by Duncan’s multiple range test.
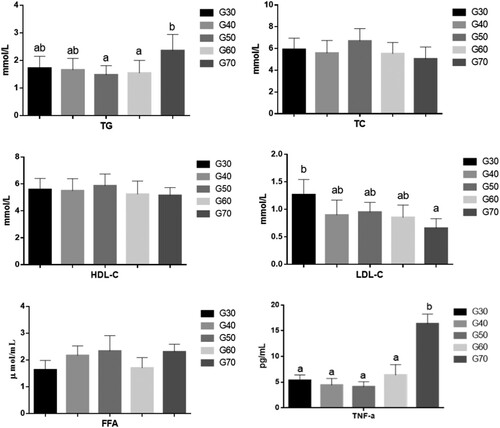
Figure 4. The liver levels of TG, TC and FFA of ICR mice in each group. Values are expressed as mean ± S.D; Within the same bar, means with different letters (a or b) are significantly different at p < 0.05 by Duncan’s multiple range test.
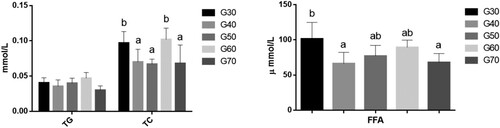
Figure 5. Photomicrographs of haematoxylin and eosin stained of mice liver under light magnification.Data shown are representative images (magnification 100×) of each group. The white arrow indicates steatosis of hepatocytes, with the nucleus centred and cytoplasm filled with transparent lipid droplets. The black arrow indicates the deposition of large fat droplets and nuclear deviation. The red arrow shows inflammatory cells infiltrating into the hepatic sinus. The yellow arrow refers to necrotic hepatocytes, cytoplasmic erythema. CV is a central vein with occasional hyperemia.
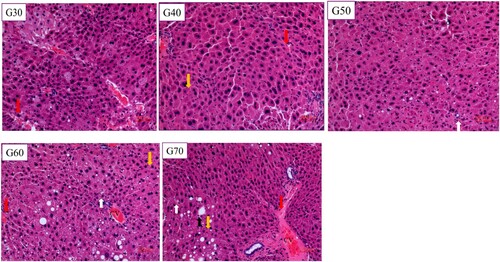
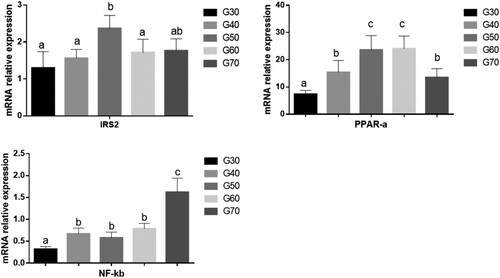
Figure 6. The mRNA expression levels of irs2, PPARα and NF-kB in the ICR mice liver. Values are expressed as mean ± S.D; Within the same bar, means with different letters (a or b) are significantly different at p < 0.05 by Duncan’s multiple range.