
Figures & data
Figure 1. Synthetic route for (A) haptens A and (B) haptens B of E3.
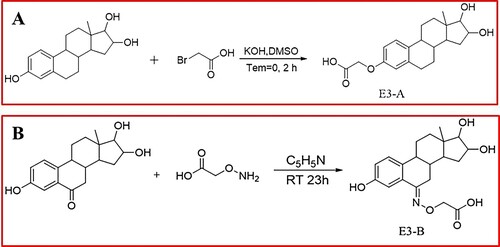
Figure 2. (A) Calibration curve and (B) ciELISA calibration curve in the linear range for histamine (n = 3).
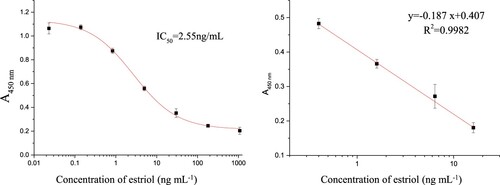
Table 1. Cross-reactivity of related compounds in ciELISA under optimised conditions
Figure 3. Analysis of matrix effect by different sample pretreatment: (A) centrifugalising method; (B) zinc acetate -potassium ferrocyanide method; and (C) dilution method.
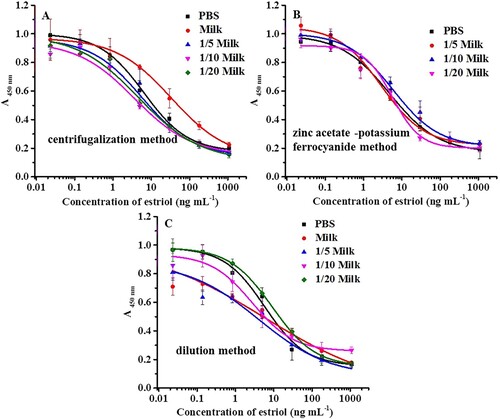
Table 2. Results of the determination of E3 in spiked milk samples with different pretreatment method under optimised conditions (n = 3).
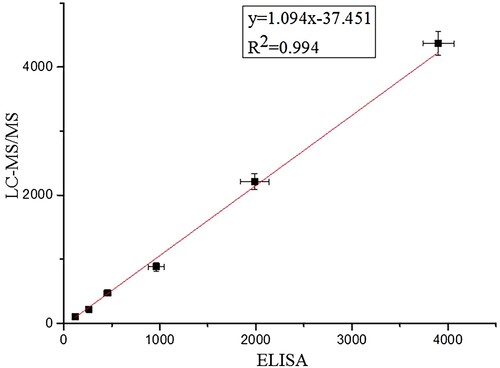
Figure 4. Correlation of HPLC results with ELISA results.
Supplemental material