Figures & data
Figure 1. Chemical structure of ISO (A) and BaP (B).
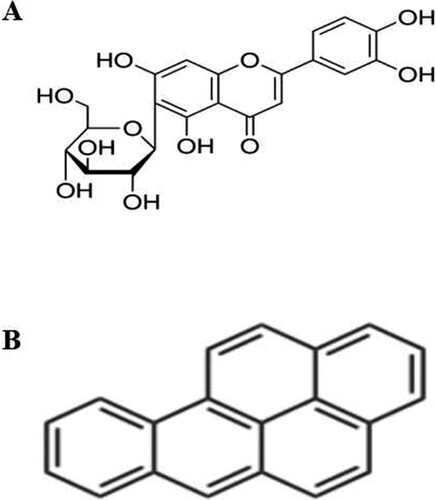
Table 1. Primer sequences used for RT-PCR.
Figure 2. Effects of ISO on BaP-induced injury in HL-7702 cells. Cells viability (A), the results are shown as the means ± SD of nine separate experiments. **p < 0.01 and *p < 0.05 versus control treatment, ##p < 0.01 and #p < 0.05 versus BaP treatment. Trypan blue staining (B), arrows indicate dead cells.
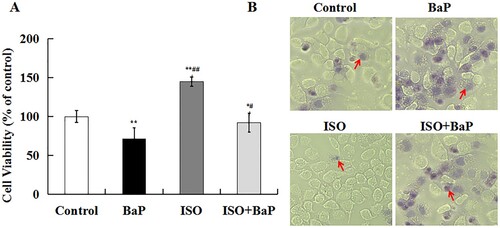
Figure 3. Effects of ISO on the autophagic injury in HL-7702 cells caused by BaP. The red fluorescence and bright green fluorescence indicate the autophagic vacuoles (A), Scale bar = 50 μm. Beclin-1 and LC3 I/II were assessed by western blot analysis, GAPDH was used as an internal control (B).
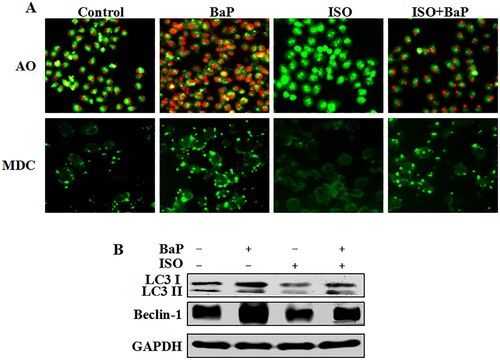
Figure 4. Effects of ISO on the pyroptotic injury in HL-7702 cells induced by BaP. The culture supernatant was used to access electrical conductivity (A), LDH release (B), NO (C). The results are shown as the means ± SD of nine separate experiments. **p < 0.01 versus control treatment, and #p < 0.05 and ##p < 0.01 versus BaP treatment. Cell pellet was to examine the pyroptotic marker proteins (Pro-Caspase-1, Cleaved-Caspase-1, iNOS, Cox-2, IL-1β, IL-18) by western blot (D).
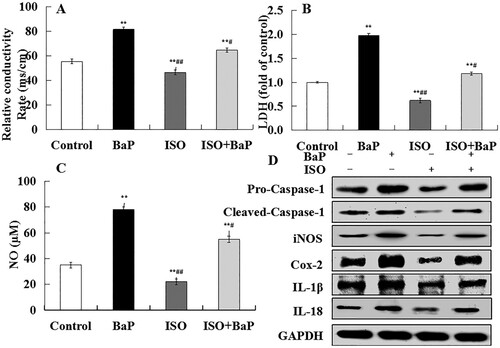
Figure 5. Effects of ISO on BaP- induced apoptotic injury in HL-7702 cells. Cells were observed by fluorescent microscopy (A). In AO-EB experiments, green cells were counted as live cells; yellow cells were early apoptotic cells; orange cells were late apoptotic cells; and red cells were dead cells. In JC-1 staining experiments, red fluorescence represents the intact MMP and green fluorescence represents the dissipation of MMP. In ROS experiments, the stronger the fluorescence, the more reactive oxygen is released. Scale bar = 50 μm. The pyroptotic marker proteins (Bcl-2, Bax, Cyto-C, Cleaved-Caspase-3, PARP) were determined by western blot, and GAPDH was used as an internal control (B).
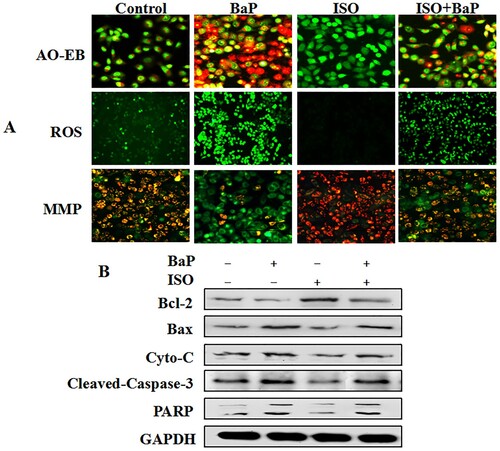
Table 2. Effects of ISO on body weight, food intake and liver index of BaP-treated mice.
Figure 6. Effects of ISO on liver function of mice exposed to BaP. Levels of TC (A), TG (B), AST (C) and ALT (D) in serum were measured to reflect the liver function after exposure with BaP or/and ISO. The results are shown as the means ± SD of thirteen separate experiments. **p < 0.01 and *p < 0.05 are compared with the control treatment, ##p < 0.01and #p < 0.05, as compared with BaP treatment.
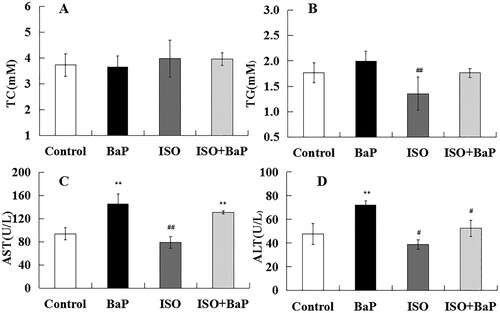
Figure 7. Effects of ISO on the antioxidant properties of mice exposed to BaP. The activities of antioxidant enzyme T-SOD (A), GSH-px (B) and the levels of oxidation products MDA (C) and H2O2 (D). The results are shown as the means ± SD of thirteen separate experiments. **p < 0.01 and *p < 0.05 are compared with the control treatment, ##p < 0.01 and #p < 0.05 are compared with BaP treatment.
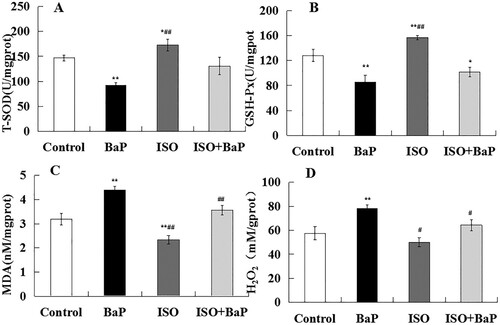
Figure 8. Effects of ISO on the histopathological changes of liver. Histopathology of liver tissue with H&E: hepatocyte nucleus (white arrow) and the interval between cells (black arrow) are shown (Original magnification of 50 μm).
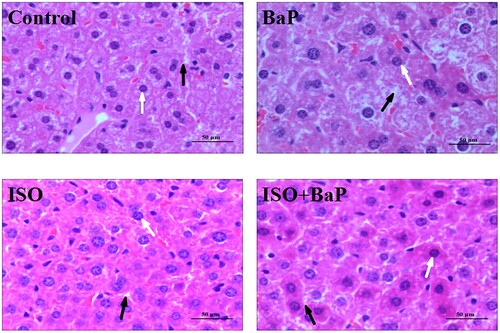
Figure 9. Effects of ISO on the autophagic injury of liver in mice exposed to BaP. TEM shows the ultrastructure of liver tissue treated with BaP and ISO. Arrows indicate autophagosomes including residual digested material (A), the mRNA levels of LC3 II (B) and Beclin-1 (C). *p < 0.05 as compared with the control group, ##p < 0.01 and #p < 0.05 are compared with BaP group.
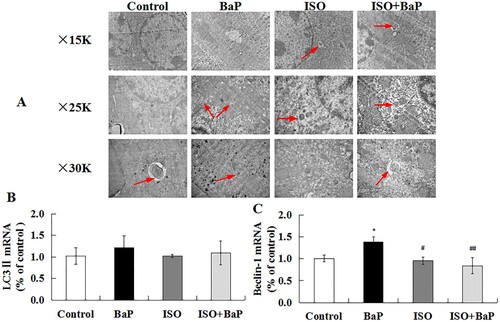
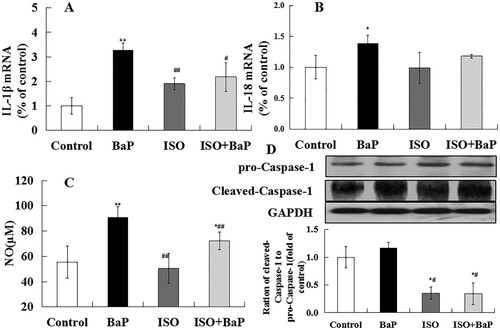
Figure 10. Effects of ISO on the pyroptotic injury of liver in mice exposed to BaP. The mRNA levels of IL-1β (A) and IL-18 (B), the level of NO (C) and the proteins expression of pro-Caspase-1, Cleaved-Caspase-1, the ration of Cleaved-Caspase-1 to pro-Caspase-1(D), **p < 0.01 and *p < 0.05, as compared with the control group, ##p < 0.01 and #p < 0.05, as compared with BaP group.