Figures & data
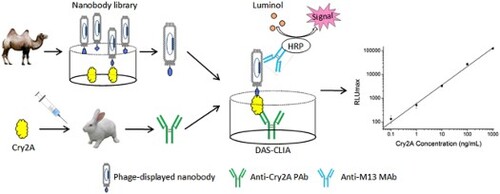
Figure 1. (a) Number of phage output in each round of panning. (b) Identification the positive clones binding to Cry2A toxin by phage-ELISA. NC, negative control.
Figure 2. (a) The amino acid sequences of the positive clones. (b) Result of matching between nanobodies and anti-Cry2A PAb detected by sandwich ELISA. NC, negative control.
Figure 3. Optimization of (a) capture antibody (anti-Cry2A PAb) and (b) detection antibody (phage-displayed nanobody P2) concentrations.
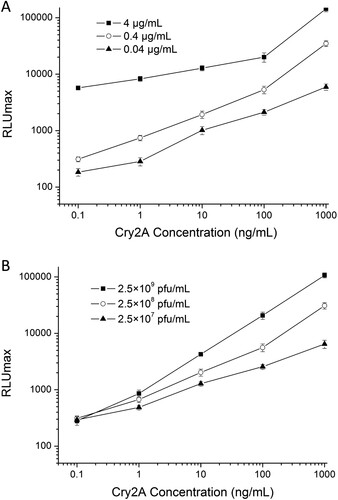
Figure 4. Standard curve of phage-displayed nanobody based DAS-CLIA for Cry2A toxin analysis under the optimized conditions.
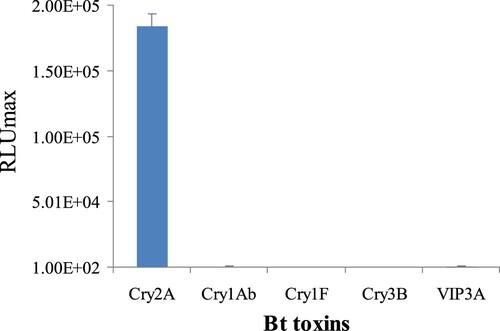
Figure 5. Cross-reactivity of the DAS-CLIA with other Bt toxins.