Figures & data
Figure 1. Effects of curry powder, clove, and turmeric extracts on DEP-induced IL-6 release in human airway epithelial cells. Cells were exposed to the indicated concentrations of DEP and each extract for 24 h. IL-6 release was measured by ELISA. Data are represented as mean ± SE of three individual cultures. **p < 0.01, versus vehicle; ##p < 0.01, versus DEP; §§ p < 0.01, vs each other.
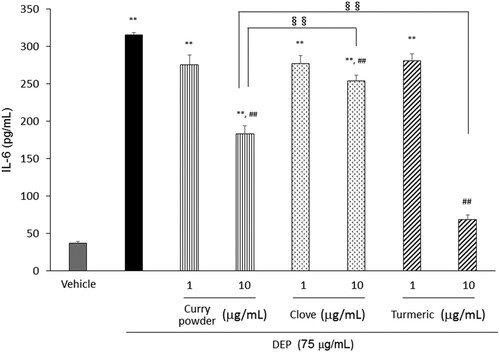
Figure 2. Effects of curry powder, clove, and turmeric extracts on DEP-induced viability of human airway epithelial cells. Cells were exposed to the indicated concentrations of DEP and each extract for 24 h. Viability was measured by WST-1 assay. Data are represented as mean ± SE of four individual cultures. **p < 0.01, versus vehicle; ##p < 0.01, versus DEP.
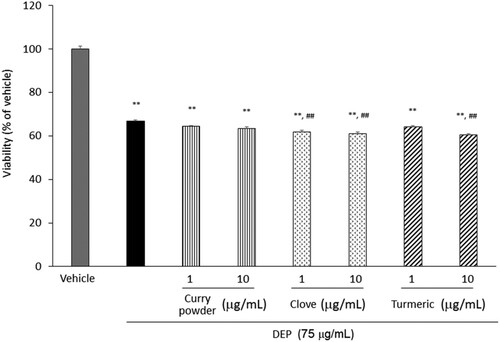
Figure 3. Effects of curry powder, clove, and turmeric extracts on DEP-induced extracellular (A) and intracellular (B) ROS. The extracellular levels of ROS were measured after exposure to DEP and each extract reacted with CM-H2DCFDA fluorescent probe for 3 h. Cells were exposed to DEP and each extract, and intracellular levels of ROS after 6 h exposure were also measured. Data are represented as mean ± SE of four individual cultures. **p < 0.01, versus vehicle; ##p < 0.01, versus DEP; §§ p < 0.01, vs each other.
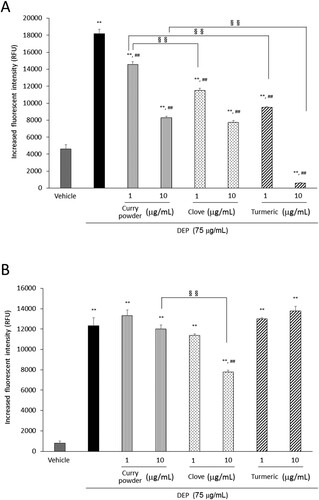
Figure 4. Effects of curry powder extract on DEP-induced IL-6 release (A) and extracellular ROS (B) in the absence of clove and turmeric. Cells were exposed to the indicated concentrations of DEP and extract for 24 h. IL-6 release was measured by ELISA. The extracellular levels of ROS were measured after DEP and extract reacted with CM-H2DCFDA fluorescent probe for 3 h. Data are represented as mean ± SE of three or four individual cultures. **p < 0.01, *p < 0.05, versus vehicle; ##p < 0.01, #p < 0.05, versus DEP.
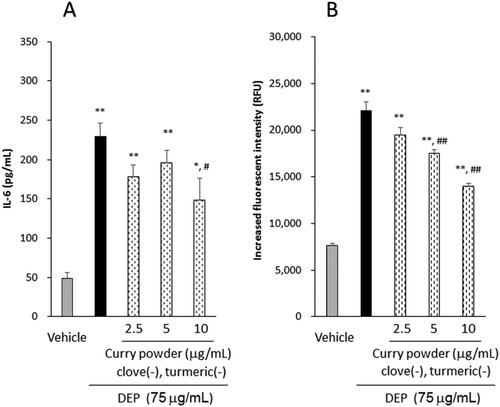
Figure 5. Effects of various extracts of curry powder components on DEP-induced IL-6 release in human airway epithelial cells. Cells were exposed to the indicated concentrations of DEP and each extract for 24 h. IL-6 release was measured by ELISA. Data are represented as mean ± SE of three individual cultures. **p < 0.01, *p < 0.05, versus vehicle; ##p < 0.01, #p < 0.05, versus DEP.
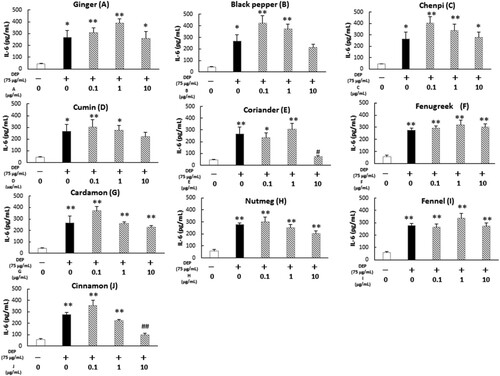
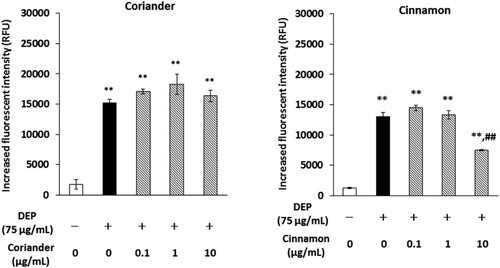
Figure 6. Effects of coriander or cinnamon extract on DEP-induced extracellular ROS. The extracellular level of ROS was measured after DEP and each extract reacted with CM-H2DCFDA fluorescent probe for 3 h. Data are represented as mean ± SE of four individual cultures. **p < 0.01, versus vehicle; ##p < 0.01, versus DEP.