Figures & data
Figure 1. SDS-PAGE-separated purified RT after CBB(Coomassie brilliant blue) staining, RT with an apparent molecular weight of ∼66 kDa, and denatured RT decomposed into two subunits, RTA and RTB; their molecular weights were 32 and 34 kda, respectively.
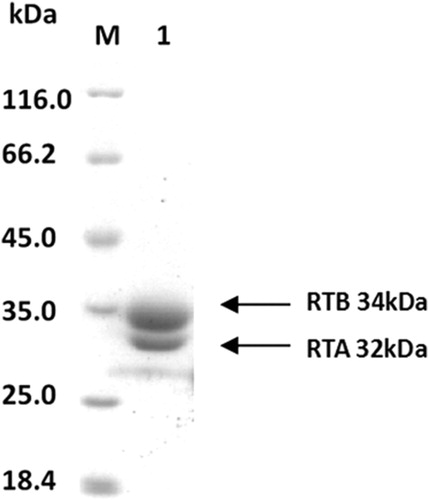
Figure 2. (A) Gel electrophoresis of amplicons from PCR analysis of the 20 selected RT-binding clones. (B) ELISA results of the binding of phage antibodies to antigens. Indirect enzyme-linked immunosorbent assay (ELISA) for determining the binding of HuscFvs expressed from various phage-infected E. coli clones to purified RT. E11 and G8 gave significant ELISA signals (OD450 nm) for RT that were greater than two times higher than bovine serum albumin (BSA) (the antigen control).
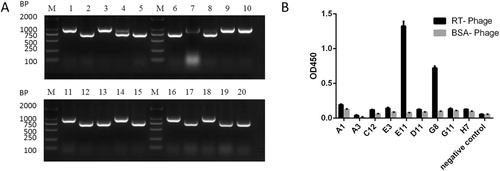
Table 1. Biopanning efficacy of phage libraries against RT.
Figure 3. SDS-PAGE (12%) analysis of fractions collected from each step of the purification process. (A) Metal chelate chromatography. Lane 1: crude extract, lane 2: flowing fluid, lane 3: fraction eluted with 20 mM imidazole, lane 4: fraction eluted with 50 mM imidazole. lane 5: fraction eluted with 100 mM imidazole, lane 6: fraction eluted with 200 mM imidazole, lane 7: fraction eluted with 400 mM imidazole. (B) Anion exchange chromatography. Lane 1: concentration of metal-bonded chromatography products, lane 2: flowing fluid, lane 3: condensed fluid.
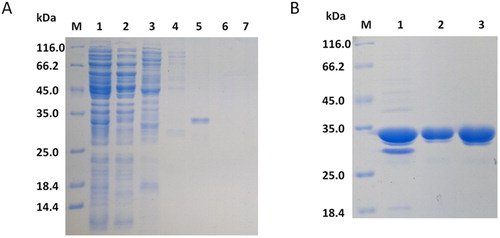
Figure 4. (A) ELISA showing good dose-dependent binding of the scFv to RT. (B) The JE11 scFv was checked for binding to RT by western blotting. Lane 1: RT.
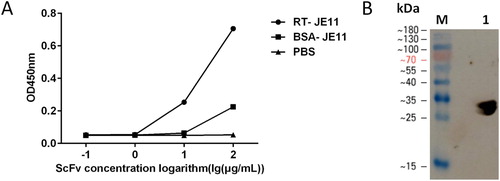
Figure 5. (A) Cell growth assay to detect the effect of JE11 on HeLa cell growth. (B) Neutralization of ricin toxicity by the JE11 ScFv.
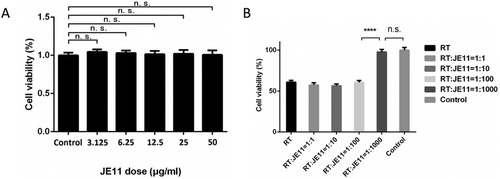
Figure 6. The antibody showed an 83% protection against injection of 2 × LD50 RT dose mice within 72 h.
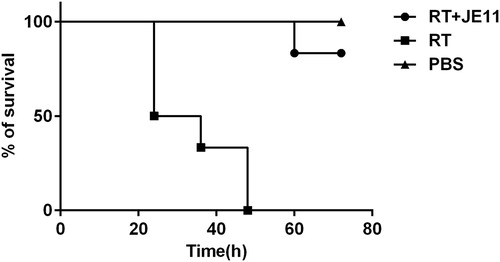
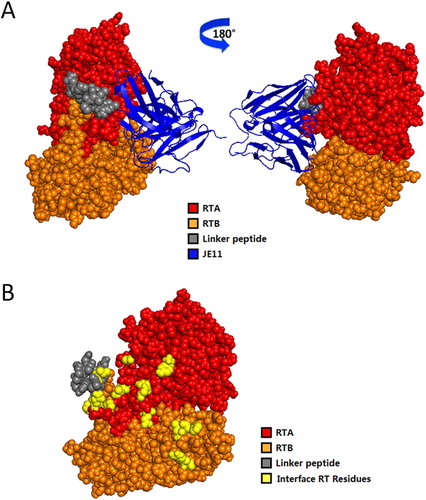
Figure 7. Computerized simulation to reveal the regions of RT bound by HuscFvs. (B) is obtained by shielding JE11 in (A). JE11 formed a contact interface with several residues in both the RTA and RTB domains. The RTA, linker peptide, RTB and JE11 are shown as red, gray, orange and blue, respectively; the interface RT residues are shown as yellow. The details of the interaction are provided in Table 2.