Figures & data
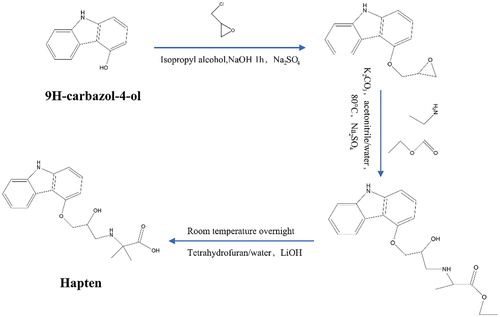
Figure 1. Hapten synthesis carazolol.
Scheme 1. Schematic illustration of the immunochromatographic assay detection of carazolol.
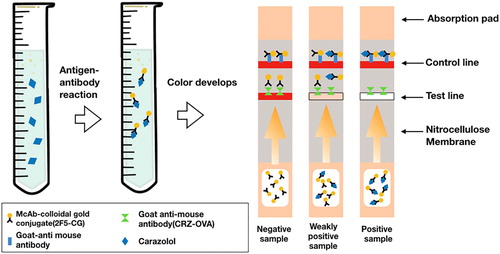
Figure 2. (a) The detection results of derivative reaction of carazolol by LC-MS. (b) 1H-NMR spectra of hapten measured in DMSO at 400MHz.
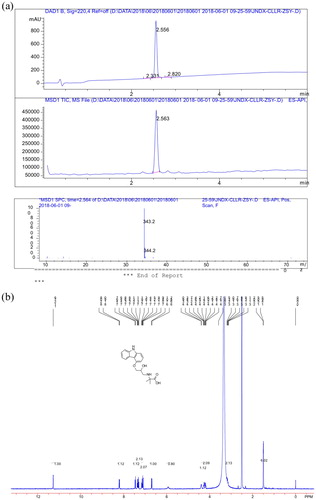
Figure 3. UV-Vis spectra of hapten and hapten-protein conjugation. (a) confirmation of immunogen (CRZ-EDC–BSA) and (b) confirmation of coating antigen (CRZ-CDI–OVA).
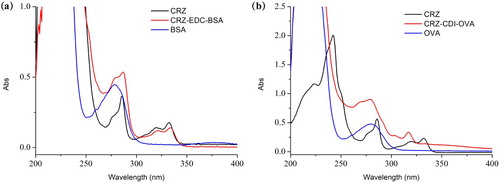
Figure 4. Standard curve obtained by indirect competitive ELISA based on antibody 2F5.
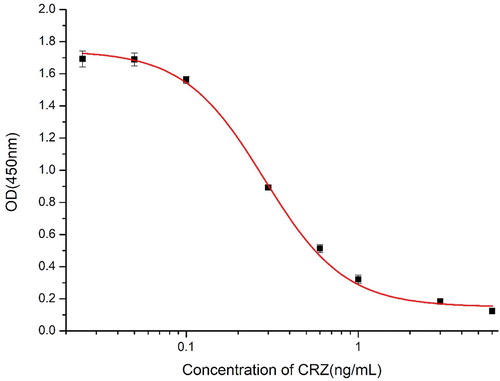
Table 1. Cross-reaction results of mAb 2F5.
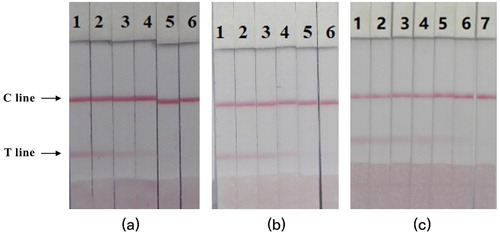
Figure 5. Image of detection CRZ by CG strip in PBS (a), milk sample (b) and porcine kidney sample (c). (a) 1 = 0 ng/mL, 2 = 0.1 ng/mL, 3 = 0.25 ng/mL, 4 = 0.5 ng/mL, 5 = 1 ng/mL, and 6 = 2.5 ng/mL; Cut-off value was 2.5 ng/mL. (b) 1 = 0 ng/mL, 2 = 0.1 ng/mL, 3 = 0.25 ng/mL, 4 = 0.5 ng/mL, 5 = 1 ng/mL, and 6 = 2.5 ng/mL; Cut-off value was 2.5 ng/mL. (c) 1 = 0 ng/mL, 2 = 0.25 ng/mL, 3 = 0.5 ng/mL, 4 = 1 ng/mL, 5 = 2.5 ng/mL, 6 = 5 ng/ mL, and 7 = 10 ng/mL; Cut-off value was 10 ng/mL.