
Figures & data
Scheme 1. Schematic representation of the BELISA procedure.
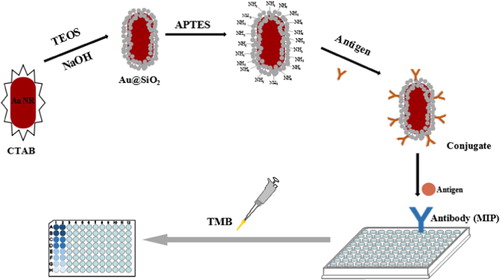
Figure 1. The FT–IR spectra of the imprinted film after extraction (a), imprinted film before extraction (b), non-imprinted film (c) and sulfadiazine (d).
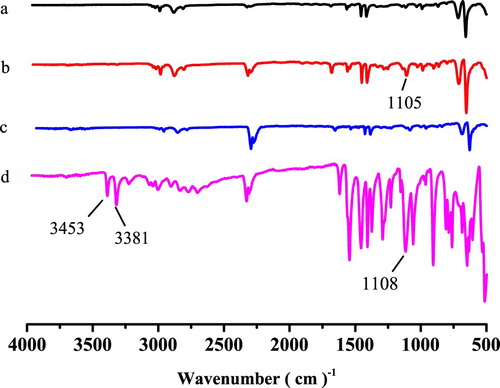
Figure 2. Effect of different solutions on the BELISA method.
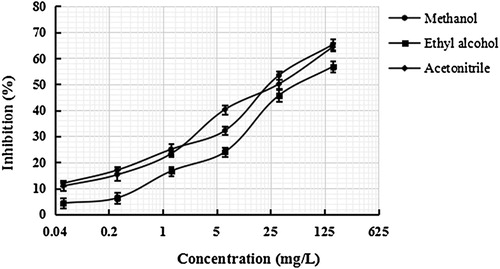
Figure 3. Standard BELISA competition curves for sulfadiazine with concentrations of 0.0512–160 mg/L in methanol.
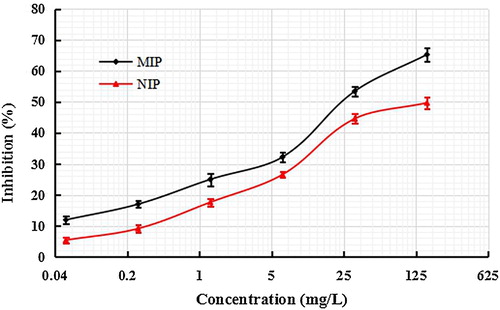
Figure 4. Cross-reactivity of three kinds of antibiotics.
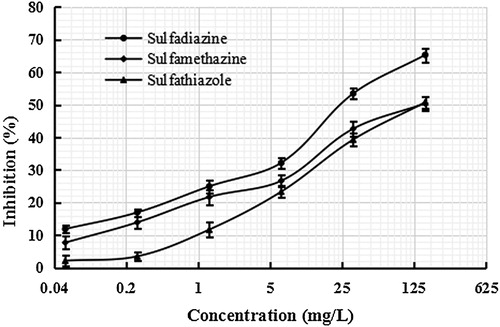
Table 1. The cross-reactivity (CR) ratio of three kinds of antibiotics.
Table 2. The recoveries of spiked sulfadiazine in beef samples by determination using the BELISA method.
Supplemental material