Figures & data
Figure 1. (A) Comparison of ODmax using PBS and Tris-HCl containing 5 mM MgCl2 as extraction buffers for chicken. (B) Matrix effect of chicken with different dilution ratios using PBS containing 5 mM MgCl2 as an extraction buffer. (C) Matrix effect of chicken using Tris-HCl containing 0.2% milk and 0.2% casein as extraction buffers. (D) Matrix effect of chicken extracts with different concentrations of skim milk. (E) Matrix effect of chicken extracts with different concentrations of NaCl. (F) Matrix effect of chicken extracts with different concentrations of BSA. (G) Standard curves of SMZ in chicken after 1/5 dilution in PBS containing 5 mM MgCl2 and 0.1% BSA. (H) Comparison of different extraction methods for chicken in terms of ODmax and IC50 values.
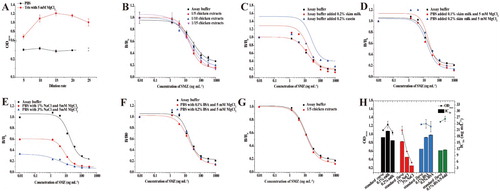
Table 1. Recovery studies from chicken, pork, eggs and honey with five SAs at three levels by DHPS-based biosensor.
Figure 2. (A) Matrix effect of pork with different dilution ratios, using PBS containing 5 mM MgCl2 as an extraction buffer. (B) Matrix effect of pork (fat removed), with different dilution ratios using PBS containing 5 mM MgCl2 as an extraction buffer. (C) Matrix effect of pork with different dilution ratios of PBS containing 5 mM MgCl2 and 0.1% BSA.
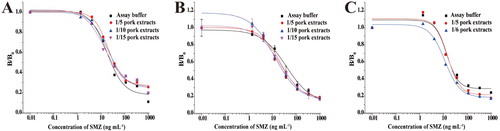
Figure 3. (A) Matrix effect of egg samples using different volumes EtoAC as an extraction buffer. (B) The effect of EtoAC concentration on recovery and ODmax values. (C) Matrix effect of egg samples using mixed solvent (4 mL ethyl acetate and 2 mL acetonitrile) as an extraction buffer. (D) Matrix effect of egg samples with different dilution ratios of PBS containing 5 mM MgCl2 and 0.1% BSA as extraction buffer.
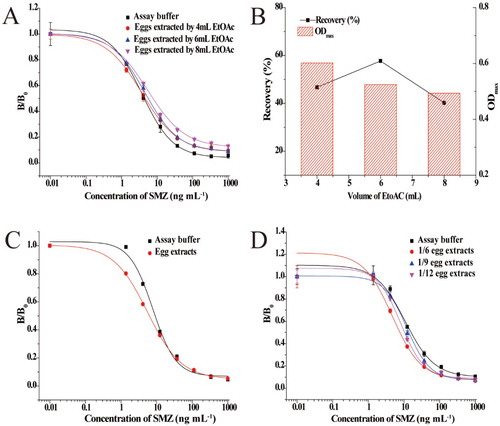
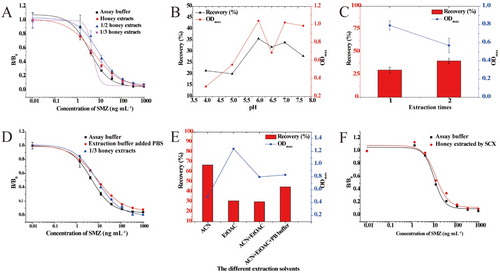
Figure 4. (A) Matrix effect of honey samples extracted with different dilution ratios. (B) The effect of pH values on the recovery and ODmax values. (C) The effect of extraction times on recovery and ODmax values. (D) Matrix effect of honey samples with PBS added and different dilution ratios. (E) The effect of different extraction solvents on recovery and ODmax values. (F) The standard curves of SMZ in honey sample extract by SCX.