Figures & data
Figure 1. Schematic drawing of the ICTS for pyrimethanil detection.
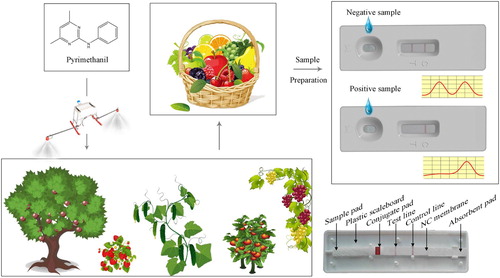
Table 1. A review of immunoassay methods for the determination of pyrimethanil in recent years.
Figure 2. The effect of immobilization concentration and incorporation rates of coating antigen. Concentration of coating antigen (pMm–BSA) on the T1, T2, T3 and T4 were 1, 0.5, 0.25 and 0.125 mg/mL, respectively. Incorporation rates of pMm–BSA were 8:1, 16:1 and 32:1. The standard concentration: negative (0 ng/mL); positive samples (40 ng/mL).
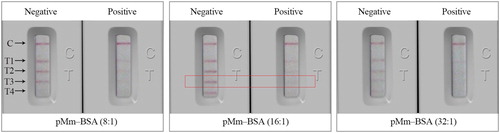
Figure 3. Series of pyrimethanil standard samples tested by developed ICTS and visual results examined after 10 min. The standard solutions of pyrimethanil at each final concentration of 0, 0.625, 1.25, 2.5, 5, 10, 20, 40, and 80 ng/mL in sample (0.1 M PBS, pH 7.4).
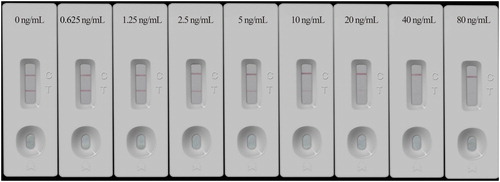
Figure 4. Standard curve of the developed ICTS for pyrimethanil quantitation in PBS (n = 5). Competitive inhibition rate was defined as B/B0 × 100%, where B0 and B represent the RODT/RODC values of the sample with/without pyrimethanil, respectively. Typical calibration curves of the ICTS by the portable strip reader with increasing pyrimethanil concentrations, from top to bottom: 0, 0.625, 1.25, 2.5, 5, 10, 20, 40, and 80 ng/mL, respectively. Good linearity of the calibration curve was achieved for pyrimethanil in the range of 1.25–20 ng/mL.
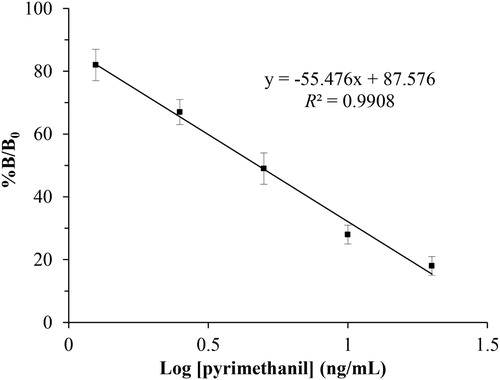
Table 2. Accuracy and reproductivity of the ICTS in pyrimethanil-fortified samples.
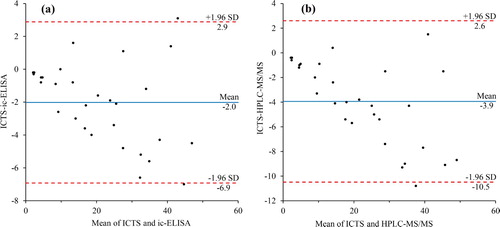
Figure 5. Bland-Altman plots to show comparisons between detection results obtained by (a) the ICTS and ic-ELISA, and (b) the ICTS and HPLC-MS/MS in fortified fruit and vegetable samples.