Figures & data
Figure 1. Structural formulas of polymyxin B, colistin, and colistin methanesulphonate.
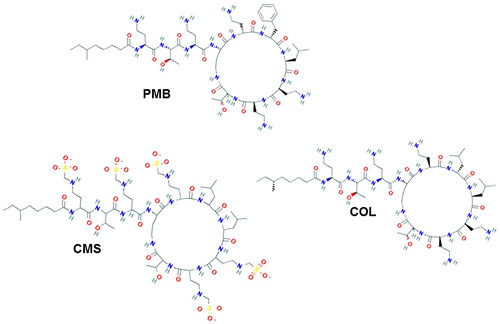
Figure 2. Scheme of synthesis conjugated antigens in carbodiimide condensation method (A) and by reductive amination of periodate-oxidazed glycoprotein (B).
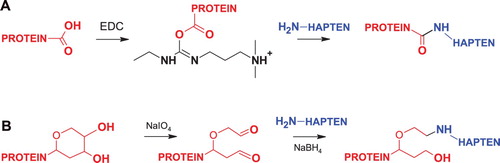
Figure 3. Spectra of BSA and BSA-PMB×50(edc) solutions (0.1 mg/mL) treated with TNBS (A). Calibration line for the determination of free amino groups (B).
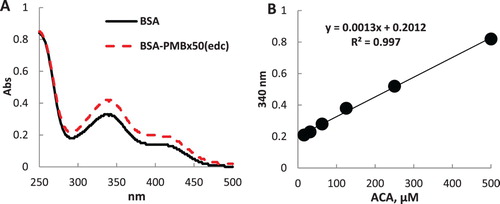
Table 1. The specificity and sensitivity of ELISAs based on heterologous antigens.
Figure 4. Interaction of anti-BSA-PMB×50(edc) with Gel(pi)-PMB×10 in various matrices. Each column represents the average value (n = 4), the error value corresponds to the standard deviation.
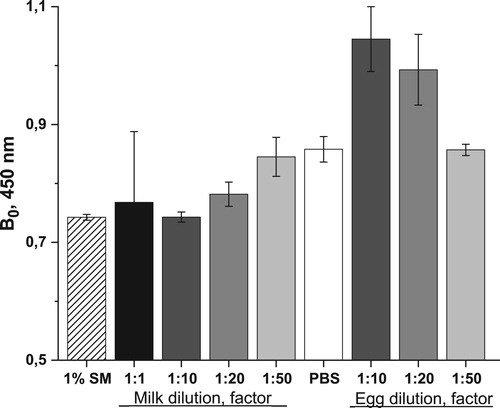
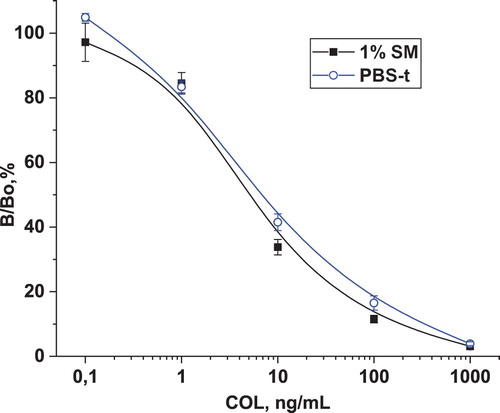
Figure 5. Calibration curves for determining the COL in milk (1% SM) and eggs (PBS-t). Each point represents the average value (n = 3), the error value corresponds to the standard deviation.