
Figures & data
Figure 1. Antibiotic resistance of E. coli isolates from bovine mastitis in five major dairy-producing regions of China.
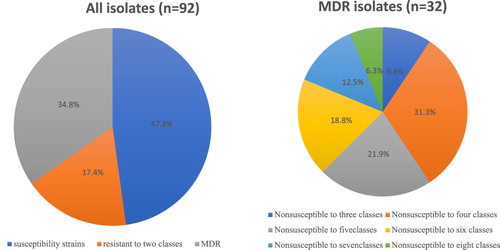
Table 1. Antibiotic resistance (%) of E. coli isolates from raw milk of mastitic cows in China.
Table 2. Antimicrobial resistance patterns of E. coli isolates.
Table 3. Percentage of resistant strains based on phylogenetic group.
Table 4. Antimicrobial resistance genes identified in E. coli isolates from raw milk of mastitic cows.
Table 5. Prevalence of virulence genes in E. coli isolates.
Table 6. Distribution of O serogroups among different phylogenetic groups.
Figure 2. Distribution of intimin types among phylogroups in E. coli isolates from bovine mastitis in China.
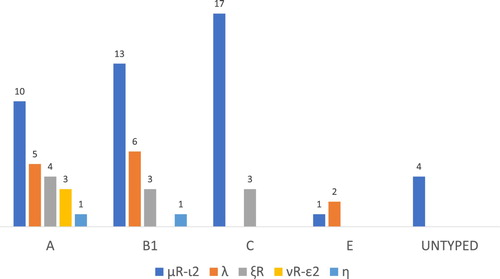
Table 7. Distribution of O serogroups among different intimin types.
Supplemental material