Figures & data
Figure 1. The structural formula of triadimefon (TDF) and triadimenol (TDN).
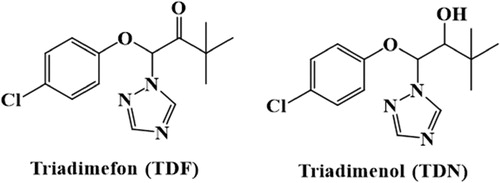
Figure 2. Synthesis of TDF hapten.
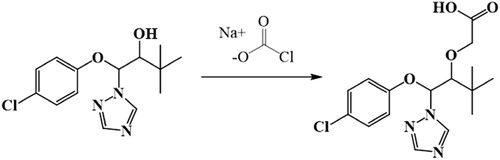
Figure 3. Identification of the molecular structure of TDF hapten: (A) total ion chromatogram (TIC) of TDF hapten; (B) extract ion chromatogram (EIC) of TDF hapten; (C) mass spectrum of TDF hapten.
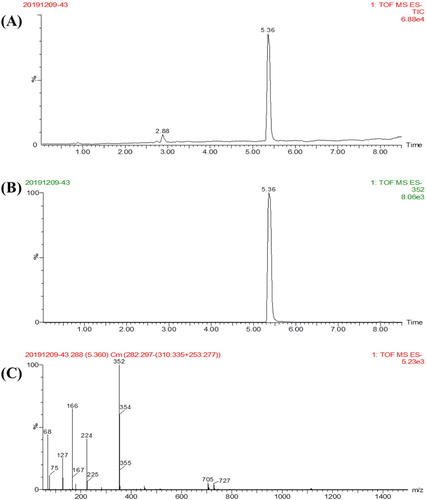
Figure 4. The ultraviolet absorption spectrum of TDF hapten-BSA (A) and TDF hapten-OVA (B).
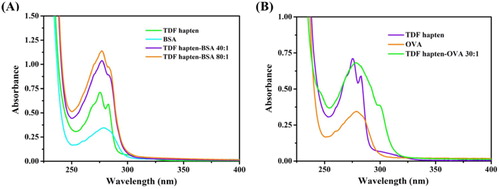
Figure 5. (A) The composition of colloidal gold test strip; (B) Principle of the CG test strip.
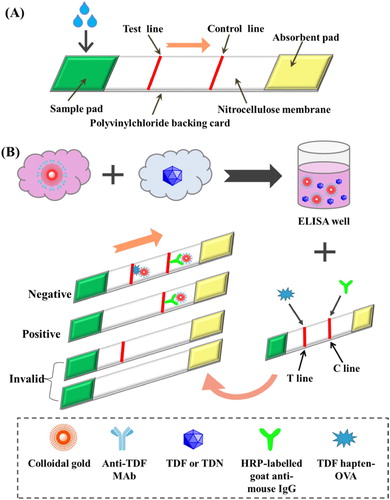
Table 1. The titres and inhibition of antisera screened by ic-ELISA.
Figure 6. The optimization of ic-ELISA: (A) the pH (4.0, 6.0, 7.4, 8.8 and 9.6) of coating buffer; (B) the ionic strength (0%, 0.4%, 0.8%, 1.6% and 3.2%, w/v); (C) DMF content (0%, 2%, 4%, 8% and 10%) of the standard diluent.
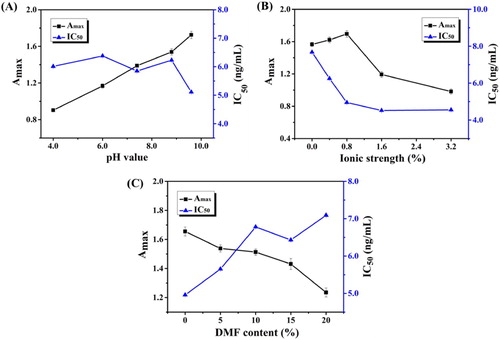
Figure 7. The indirect competition inhibition curves (A) (B) and cross reaction (C) of the MAb.
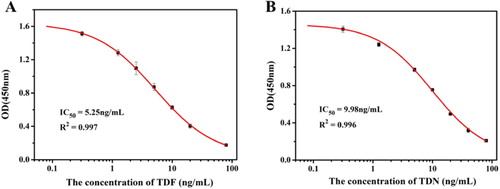
Table 2. The detection of cross reaction by ic-ELISA.
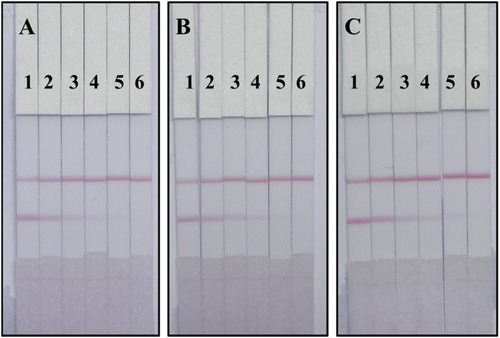
Figure 8. Images of TDF and TDN detection by CG test strip in tomato sample: (A) tomato sample spiked with TDF; (B) tomato sample spiked with TDN; (C) tomato sample spiked with TDF mixed with TDN (1:1, w/w). A series of tomato samples spiked with TDF and TDN were tested by colloidal gold test strip: 1=0 ng/g, 2=10 ng/g, 3=25 ng/g, 4=50 ng/g, 5=100 ng/g and 6=250 ng/g.