Figures & data
Figure 1. Schematic illustration of the immunochromatographic lateral flow strip test.
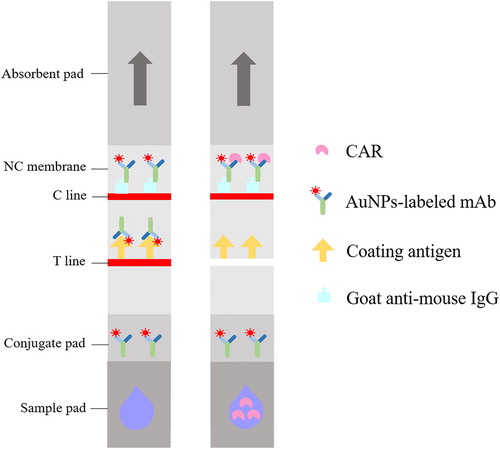
Figure 2. The UV/Vis spectra of immunogen (a) and coating antigen (b).
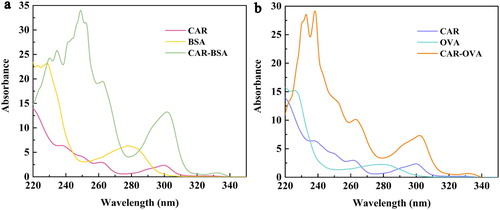
Figure 3. The subtype of 1F5-C8 (a) and the standard curve of CAR detection by the ic-ELISA in PBS (b).
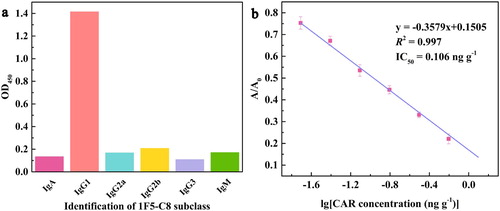
Table 1. The cross-reaction of CAR with other compounds by ic-ELISA in bovine muscle samples.
Table 2. The optimized experimental parameters of the test strip.
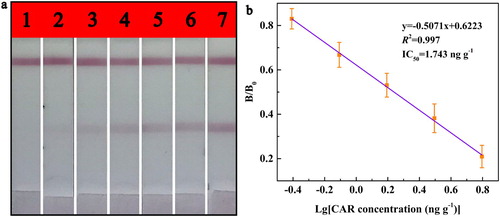
Figure 4. The bovine muscle samples with multiple concentrations of CAR were analysed by the immunochromatographic strips (a, 1 - 7: 12.50, 6.25, 3.13, 1.57, 0.79, 0.40 and 0 ng g−1). The standard curve of CAR detection by the immunochromatographic strips (b).