Figures & data
Figure 1. The process of synthesize Pb-ITCBE-KLH and Pb-ITCBE-BSA.
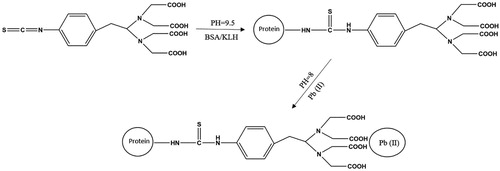
Figure 2. Composition of fluorescent strip.
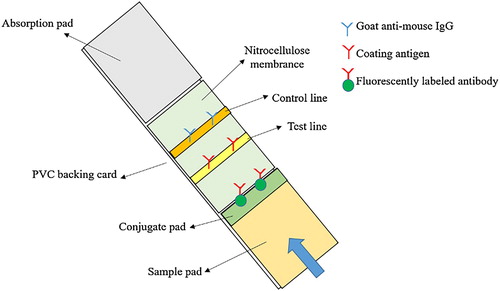
Figure 3. (a) The UV–Vis spectra of Pb-ITCBE-BSA and Pb-ITCBE-KLH, (b) The polyacrylamide gel electrophoresis image of Pb-ITCBE-BSA (1 Pb-ITCBE-BSA, 2 BSA).
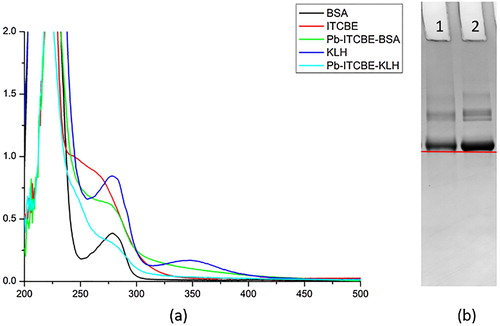
Figure 4. The standard curve of developed ic-ELISA method.
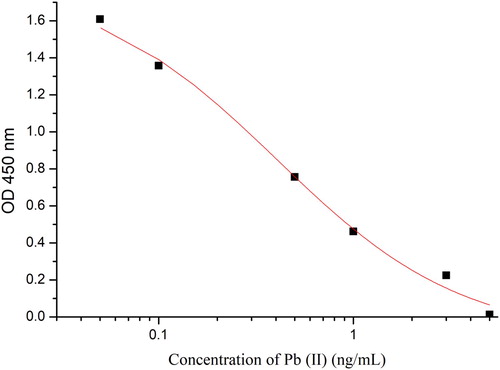
Table 1. The CR value of 2C3 against Pb(II) by the ic-ELISA method.
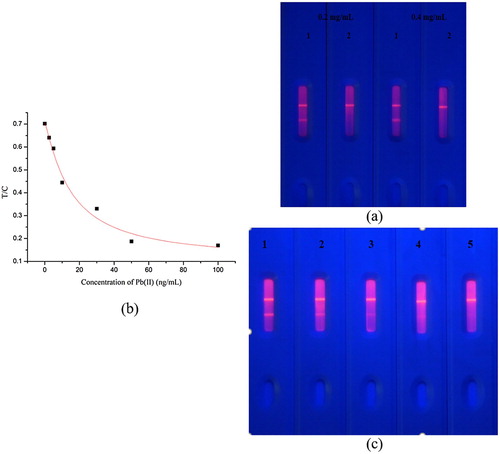
Figure 5. (a) Optimization of two kinds of coating concentration. (0.2 and 0.4 mg/mL, and pad 1 = 0 ng/mL and pad 2 = 100 ng/mL). (b) The sensitivity of the test strip (n = 8). 1 = 0 ng/mL, 2 = 1 ng/mL, 3 = 2.5 ng/mL, 4 = 5 ng/mL, 5 = 10 ng/mL, 6 = 25 ng/mL, 7 = 50 ng/mL, and 8 = 100 ng/mL.
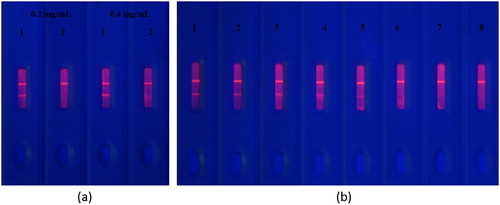
Figure 6. (a) The standard curve of fluorescence strip detection Pb(II) in brown rice. (b) Optimization of two kinds of coating concentration in brown rice. (0.2 and 0.4 mg/mL, and pad 1 = 0 ng/mL and pad 2 = 100 ng/mL). (c) The sensitivity of the fluorescence strip in brown rice. (n = 8). 1 = 0 ng/mL, 2 = 10 ng/mL, 3 = 25 ng/mL, 4 = 40 ng/mL, 5 = 50 ng/mL.