Figures & data
Figure 1. Chemical structure of OTA.

Figure 2. The UV spectra of OTA, proteins and conjugates; (a) The UV spectra characterization for OTA, BSA, and OTA-BSA; (b) The UV spectra characterization for OTA, KLH, and OTA-KLH.
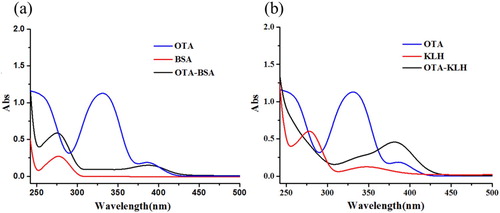
Figure 3. Standard curve for OTA detection.
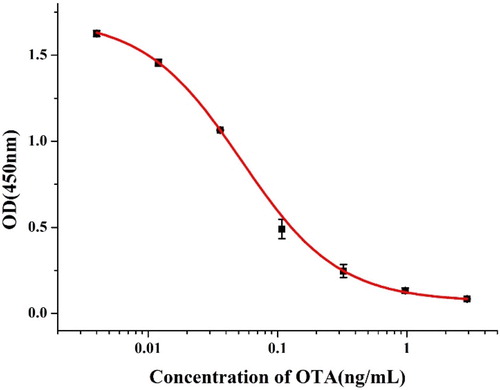
Table 1. Cross-reactivity of mAb 3D6 to four Ochratoxin.
Figure 4. Optimization of conditions of test strip. (a) Result of using different surfactants (Resus1, 2, 4 and 14 represent PEG, PVP, BSA and On-870, respectively). 1 and 2 represent the OTA standard concentrations were 0 and 25 ng/mL, respectively, prepared in rice flour sample. (b) Optimization of the concentration of antigen on the T line by testing OTA standard prepared in rice flour sample. Each test was repeated thrice.
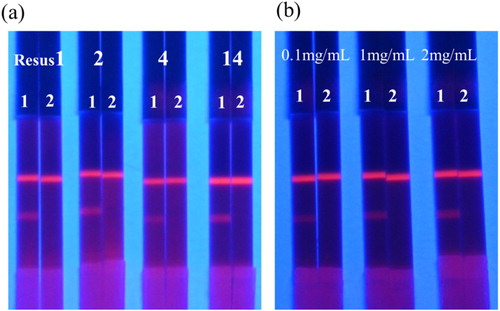
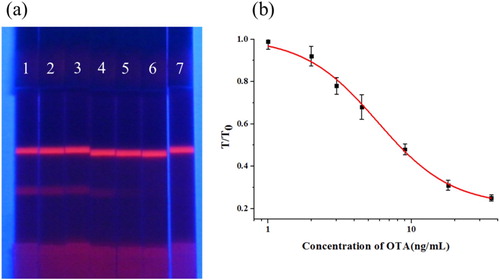
Figure 5. Sensitivity test of strip. (a) Detection of OTA in rice flour samples using the FM-ICTS. (1 = 0 ng/mL, 2 = 0.5 ng/mL, 3 = 1 ng/mL, 4 = 2 ng/mL, 5 = 4 ng/mL, 6 = 8 ng/mL and 7 = 16 ng/mL). (b) The calibration curve obtained by a strip reader. The X-axis is shown as the concentrations of OTA; and the Y-axis is shown as the T/T0 value, which is defined as the ratio of the optical density of the positive sample to that of the negative sample.