Figures & data
Figure 1. (a) Macrophage proliferation index; (b) Macrophage cytotoxicity index; (c) Macrophage phagocytosis index. Values are means ± SDs. Different lowercase letters (a > b > c > d) means a significant difference in a different treatment group (P < .05).
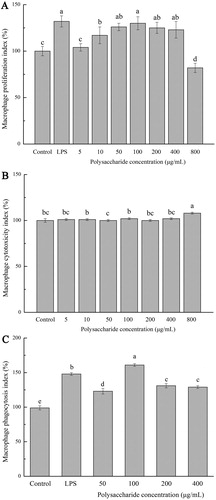
Figure 2. (a,b) NO production; (c) IL-1β concentration; (d) IL-10 concentration. Values are means ± SDs. Different lowercase letters (a > b > c > d) mean a significant difference in a different treatment group (P < .05).
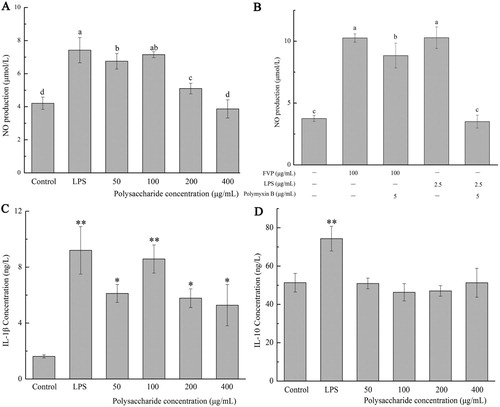
Figure 3. (a) Body weight; (b) food consumption; (c) energy intake. Values are means ± SDs.
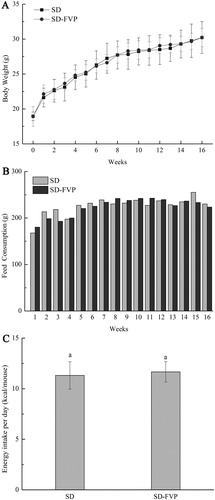
Figure 4. The Effects of FVP on the relative expression of mRNA in the colon. (a) IL-1β; (b) IL-10; (c) iNOS; (d) ZO-1. Values are means ± SDs. n = 12. Different lowercase letters (a > b) mean a significant difference in a different treatment group (P < .05).
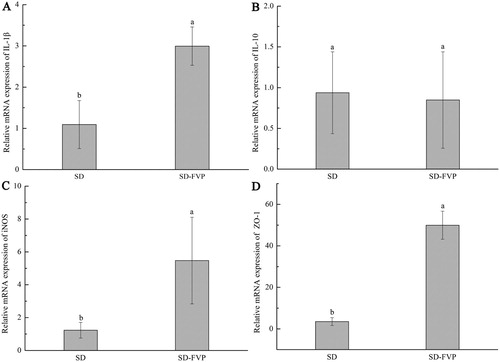
Figure 5. Mouse faecal microbiota diversity based on 16S rRNA gene sequences. (a) Principal Component Analysis (PCA); (b) sample cluster tree; (c) heat map; (d) Venn diagram.
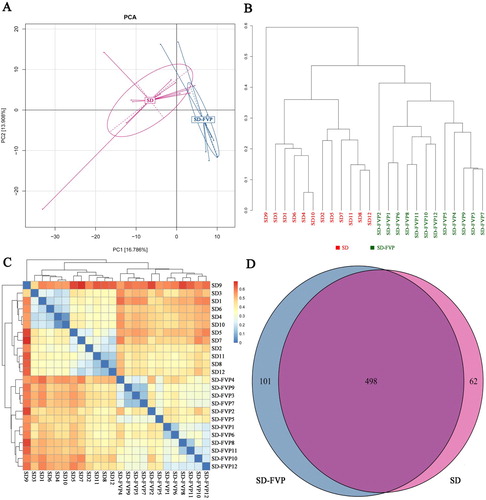
Figure 6. Gut microbial compositions of mice at phylum level. (a) Relative abundance of major phyla across 24 faecal microbiomes; (b) Relative abundance of Bacteroidetes across each grouped microbiome; (c) Relative abundance of Firmicutes across each grouped microbiome. Values are means ± SDs. n = 12. Different lowercase letters (a > b) mean a significant difference in a different treatment group (P < .05).
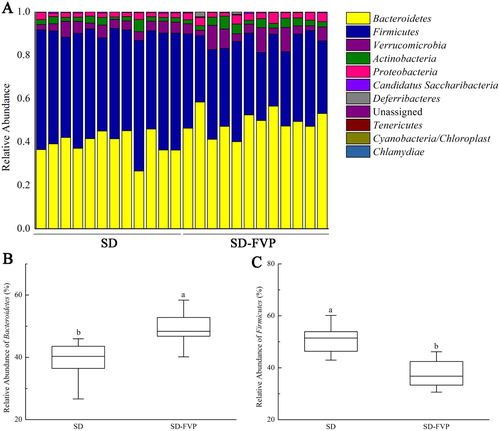
Figure 7. Gut microbial compositions of mice at the family level. (a) Relative abundance of major species across 24 faecal microbiomes; (b–g) Relative abundance of different species across each grouped microbiome. Values are means ± SDs. n = 12. Different lowercase letters (a > b) mean a significant difference in a different treatment group (P < .05).
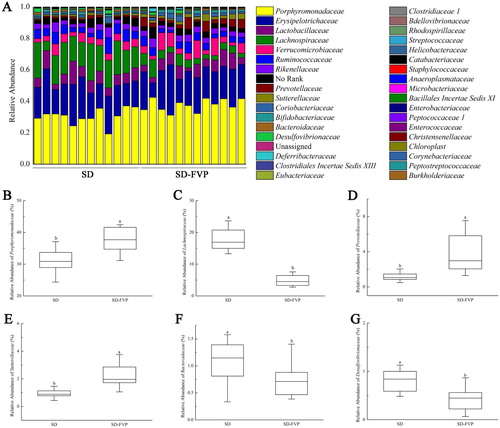
Figure 8. Correlation of 17 species altered by FVP intervention by the Spearman correlation analysis. Heatmap shows the value of correlation coefficient. * and ** indicate the significant associations (P < .05 and P < .01, respectively). The circles (○) and dots (●) represent the less and more relative abundances of genus in the SD-FVP group compared with the SD group.
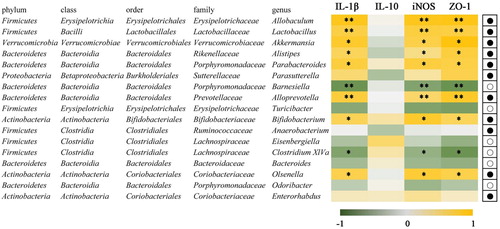
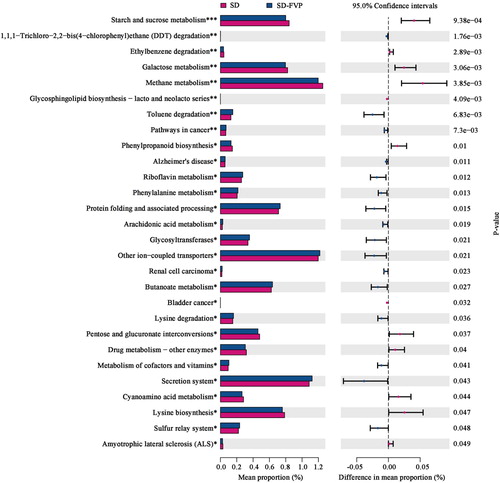
Figure 9. PICRUSt predicted microbial community function changes reversed by FVP. *, ** and *** indicate the significant associations.