Figures & data
Figure 1. Animals treatment.
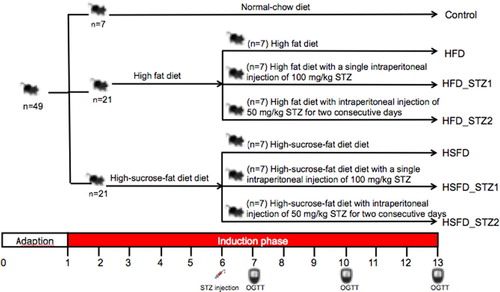
Figure 2. The association of glucose metabolism with diet and STZ injection. (A) Weight gain; (B) Fasting blood glucose; (C) Hepatic glycogen; (D) AUC of OGTT; (E) HOMA-IR. Data are presented as the mean ± SEM (n=7 mice/group). Different superscript letters are significantly different (P <0.05).
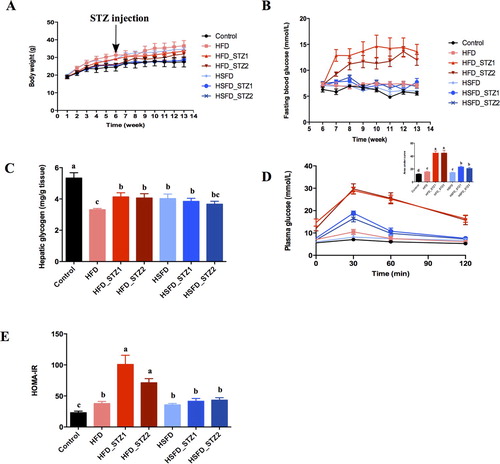
Figure 3. The association of lipid metabolism with diet and STZ injection at 13 week. (A) Indices of perirenal fat and epididymal fat; (B) Plasma lipid; (C) Hepatic lipid accumulation. Data are presented as the mean ± SEM (n=7 mice/group). Different superscript letters are significantly different (P < 0.05).
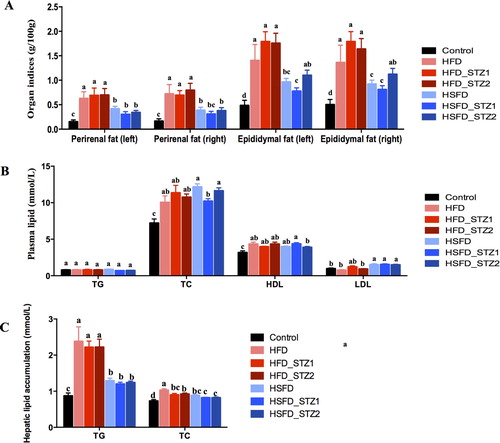
Figure 4. Hematoxylin and eosin staining of tissue in mice (original magnification, ×200). (A) Liver; (B) Epididymal fat pads; (C) Pancreas; (D) Cecum; (E) Colon. The black arrow pointer indicates fat droplets. The red arrow pointer indicates inflammatory cell infiltration. The blue arrow pointer indicates cytoplasmic loosening.
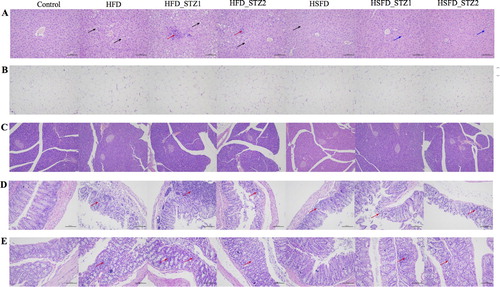
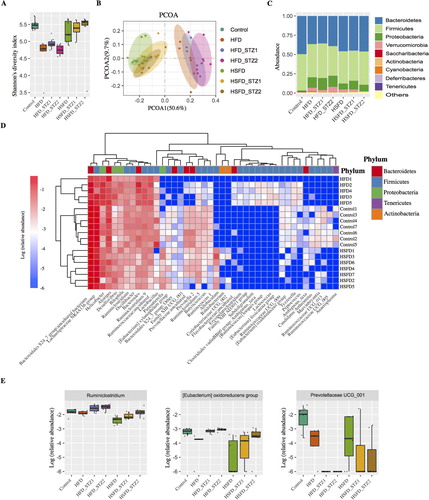
Figure 5. The association of gut microbiota with diet and STZ injection. Alpha-diversity of gut microbiota based on the OTU table, measured by (A) Shannon index and (B) PCoA of Bray-Curtis distances based on the genus level of gut microbiota: each dot represents a sample and each color denotes a group. (C) The relative abundance of each Phylum of gut microbiota in each group. (D) Differentiated genera among the controls, HFD, and HSFD groups and (E) special genera associated with STZ injection.