Figures & data
Figure 1. The synthesis routes of the 2-CPAMOZ and 2-NPAMOZ.
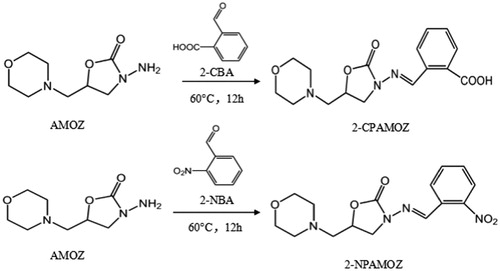
Figure 2. The UV-VIS spectroscopy of 2-CPAMOZ, protein and conjugates: (a) confirmation of immunogen (2-CPAMOZ-KLH) and (b) confirmation of coating antigen (2-CPAMOZ-OVA, 2-CPAMOZ-BSA).
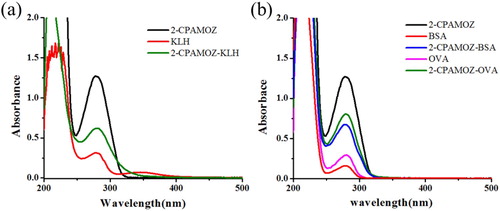
Figure 3. Standard curve for 2-CPAMOZ detection with mAb 4G11.
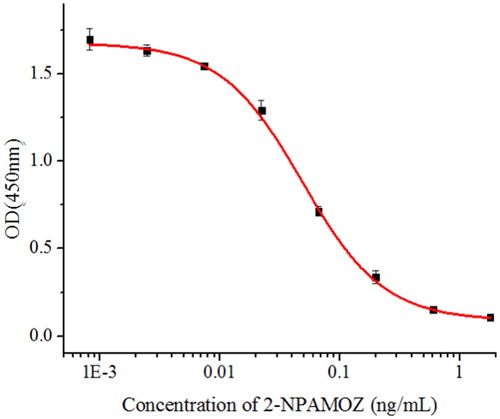
Table 1. Sensitivity and affinity of mAbs with different coating antigens.
Table 2. CR of mAb 4G11 with various drugs and marker residues.
Figure 4. The strip results for AMOZ in PBS: (a) Optimization of the concentrations of mAb and coating antigen. 1 = 0 ng/mL, 2 = 5 ng/mL. (b) Photo image of detection a series of 2-NPAMOZ in PBS by gold immunochromatographic strip. 1 = 0 ng/mL, 2 = 0.0025 ng/mL, 3 = 0.005 ng/mL, 4 = 0.01 ng/mL, 5 = 0.025 ng/mL, 6 = 0.05 ng/mL, 7 = 0.1 ng/mL.
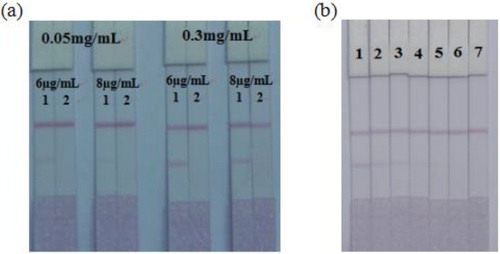
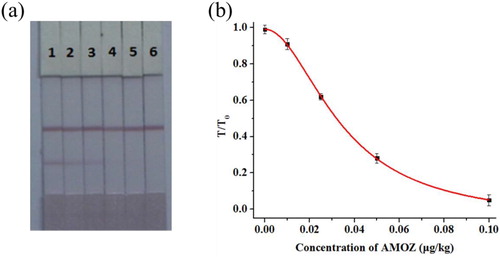
Figure 5. The strip results for AMOZ in spiked catfish samples: (a) Photo image of detection a series of catfish samples spiked AMOZ by gold immunochromatographic strip. 1 = 0 μg/kg, 2 = 0.01 μg/kg, 3 = 0.025 μg/kg, 4 = 0.05 μg/kg, 5 = 0.1 μg/kg, 6 = 0.25 μg/kg. (b) The calibration curve for the strip result. The Y-axis is shown as the T/T0 value; The X-axis is shown as the concentrations of AMOZ. T: the colour intensity of the given sample; T0: the colour intensity of the blank sample.