Figures & data
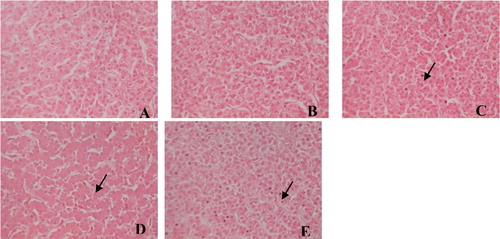
Figure 1. Hepatic histology in laying hens fed a control diet supplemented with 0 (A), 20 (B),70 (C), 120 (D) and 170 mg/kg FG(E) (haematoxylin-eosin staining, original magnification×40). Hepatic histology shows acidophil body (arrows) in mild hepatitis in FG 70 (C), FG 120 (D) and FG 170 (E) groups.