Figures & data
Figure 1. Chemical structure of praziquantel.
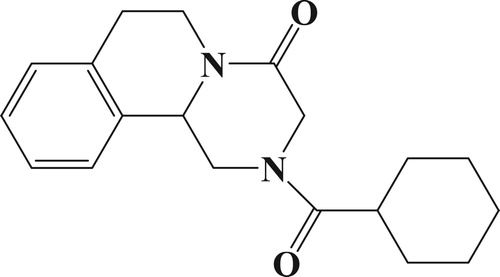
Figure 2. Result of UV/vis spectrometry for, (a) PZQ-HS, BSA, and PZA-HS-Dia-BSA, and (b) PZQ-HS, OVA, and PZQ-HS-GA-OVA.
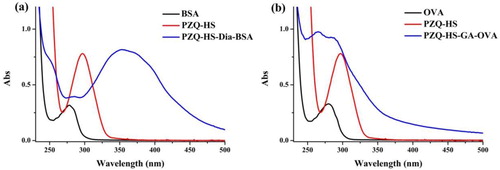
Figure 3. Standard inhibition curve of PZQ using icELISA.
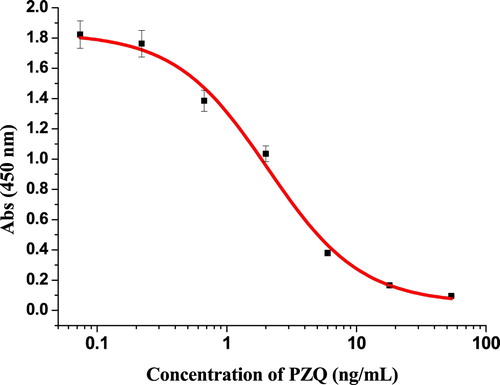
Figure 4. Schematic and illustration of LFIA. T-line, test line; and C-line, control line.
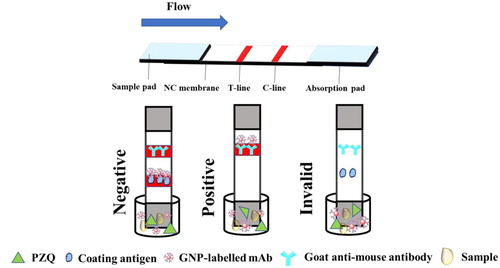
Figure 5. Optimization of LFIA with 0.01 M PBS (pH 7.4). The concentration of coating antigen: (A) 0.3 mg/mL and (B) 0.8 mg/mL. The dosage of mAb that conjugate with GNP; (a) 10 µg/mL, and (b) 8 µg/mL. Standard concentration; (1) 0 ng/mL, and (2) 10 ng/mL.
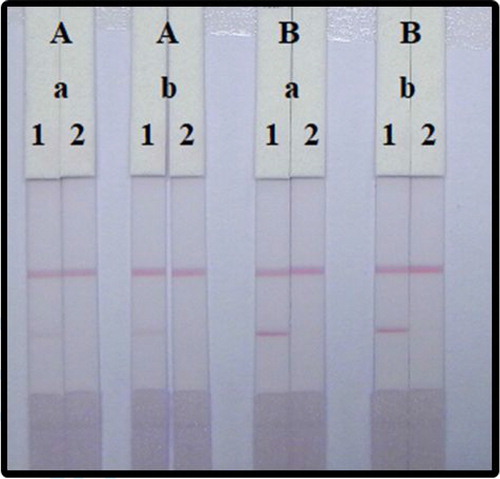
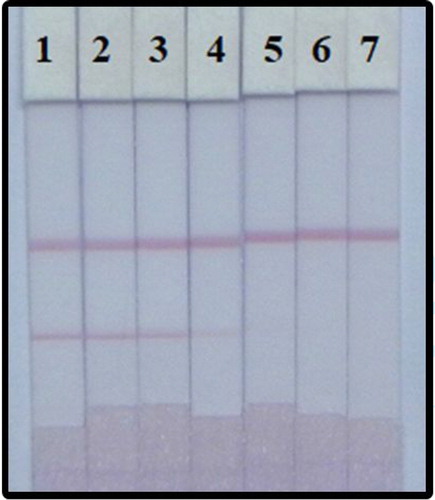
Figure 6. LFIA of detection PZQ in 0.01 M PBS (7.4). PZQ concentration: 1 = 0 ng/mL, 2 = 0.1 ng/mL, 3 = 0.25 ng/mL, 4 = 0.5 ng/mL, 5 = 1 ng/mL, 6 = 2.5 ng/mL, and 7 = 5 ng/mL.
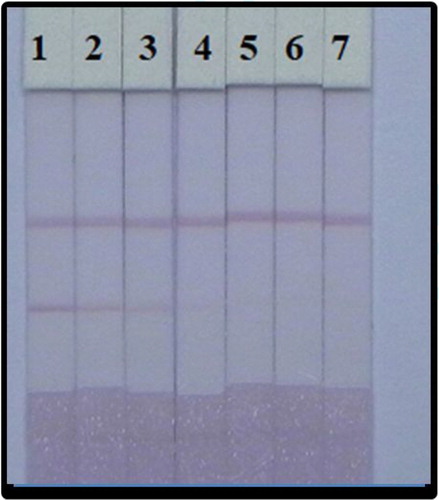
Table 1. Cross-reaction results for the assay selectivity using ELISAs.
Figure 7. Optimization LFIA spiked in fish. 5 different kinds of reagents; (A) basic buffer, (B) PVP, (C) PEG, (D) BSA, and (E) Rhodasurf® On-870. Standard concentration; (1) 0 µg/mL, and (2) 10 ng/mL.
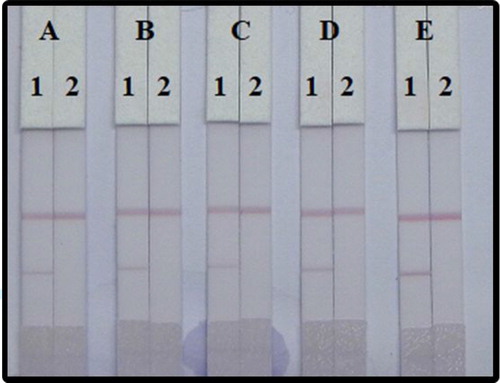
Figure 8. Determination of PZQ spiked in fish. After optimization (1–7) represents concentrations of 0, 0.1, 0.25, 0.5, 1, 2.5, and 5 ng/mL.