Figures & data
Figure 1. Effect of fucoidan on insulin and blood glucose. For both groups, IPGTT was performed before sacrificed. The results showed that glucose tolerance was significantly increased after fucoidan treatment. Compared to the control group, fucoidan treatment significantly lowered blood glucose levels at 60 and 120 min after glucose load (P < 0.05). (A) Insulin level. (B) blood glucose level. *P < 0.05 vs the control group.
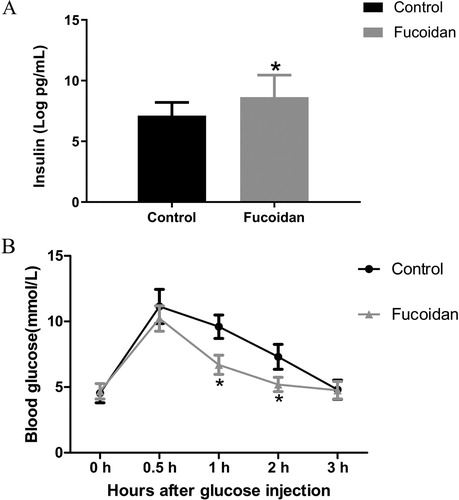
Figure 2. Pathological changes of the jejunal and colonic tissues. (A) Histopathological changes of intestinal. To study the effect of fucoidan on the intestinal tissue of NOD mice, the colonic and jejunal tissues were obtained and dyed with HE. Tissue from the control group exhibited histological damage with increased infiltration of inflammatory cells. However, fucoidan attenuated the pathological changes in the jejunal and colonic tissues of NOD mice. (B) Ultrastructure observations of intestinal tissues. The tight junction became fuzzy and slight relaxation with low electron density in the control group. In the fucoidan group, histological morphology and the tight junctions were improved. 1, tight junction; 2, adherens junction; 3, Desmosome. *P<0.05 vs the control group.
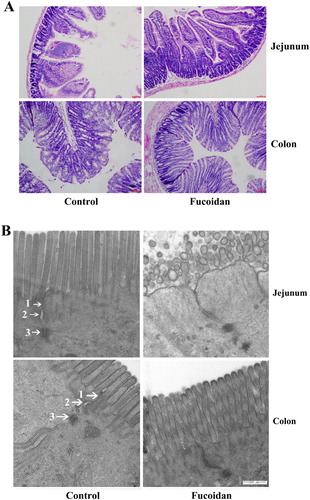
Figure 3. Effect of fucoidan on intestinal permeability. The levels of DAO, D-LA, FABP2 and endotoxin were detected by ELISA. The data showed that after fucoidan treatment, the levels of DAO, D-LA and endotoxin were reduced compared with those in the control group (P < 0.05). Intestinal permeability fluorescence results showed that loss of continuity of the fluorescent substance and lacked closure was observed in the control group. However, in the fucoidan group, the fluorescent substance was restored continuity, and intestinal permeability was much improved. *P<0.05 vs the control group.
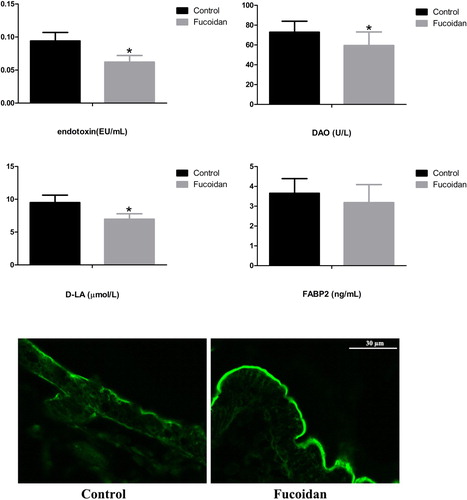
Figure 4. Effect of fucoidan on Th1/Th2/Th17. The expression of IFN-γ, IL-4 and IL-17A was detected by flow cytometry. Our results implied that fucoidan treatment notably reduced the IFN-γ, IL-4 and IL-17A levels and ameliorated the IFN-γ/IL-4 ratio. *P<0.05 vs the control group.
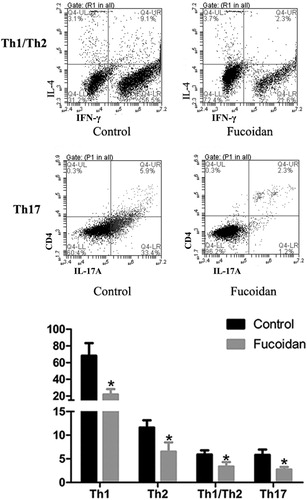
Figure 5. Effect of fucoidan on the expressions of Occludin, claudin-1 and ZO-1. Western blot analysis was used to detect the expressions of Occludin, claudin-1 and ZO-1; β-actin was used as an internal standard. After fucoidan treatment, the levels of Occludin, claudin-1 and ZO-1 were significantly higher than those in the control group. As shown in the fluorescence microscope, the intestinal tissues in the control group displayed significantly weaker ZO-1 staining compared to the fucoidan group. *P < 0.05 vs. the control group; **P < 0.01 vs. the control group.
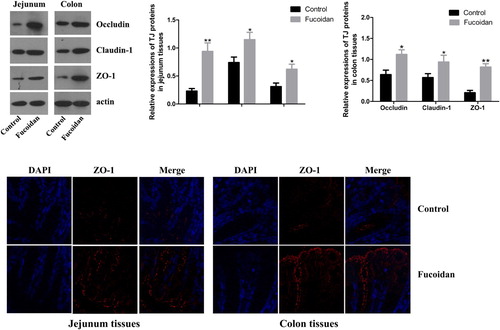
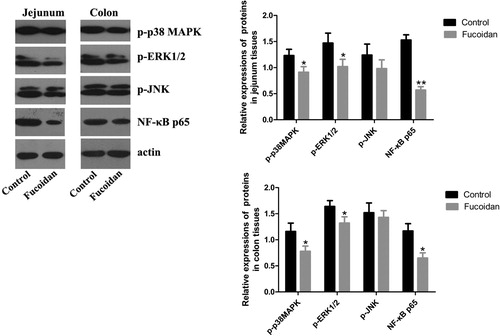
Figure 6. Effect of fucoidan on p-p38 MAPK, p-ERK1/2, p-JNK and NF-κB p65. We analyzed the expressions of p-p38 MAPK, p-ERK1/2, p-JNK and NF-κB p65 by western blots. The levels of p-p38 MAPK, p-ERK1/2 and NF-κB p65 in the fucoidan group were lower than those in the control group. However, there was no statistical significance in p-JNK level. *P < 0.05 vs. the control group; **P < 0.01 vs. the control group.