Figures & data
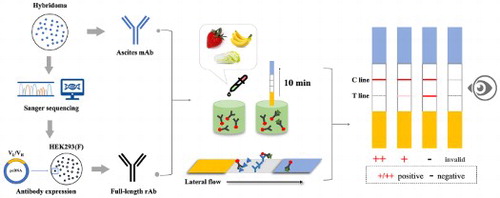
Figure 1. Chemical structures of pyraclostrobin (A) and its hapten (B).
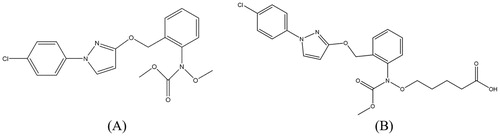
Table 1. Primer sequences for VH and VL gene amplification.
Figure 2. Partial constructs of the expression vector and the illustration of homologous recombination.
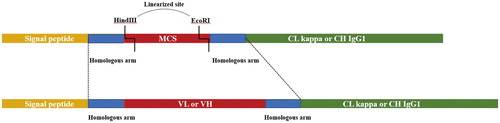
Table 2. Primers of PCR progress for obtaining homologous recombination fragments.a
Figure 3. (A) Schematic illustration of the detection procedure by GNPs-ICS. (B) The decision criterion of GNPs-ICS assay. * (B) Negative samples (-), positive samples (+) and strongly positive samples (++) judged by naked eyes.
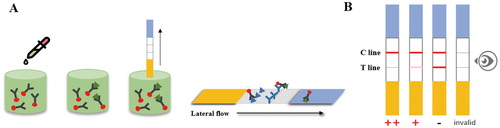
Table 3. The ratio of gradient elution of pyraclostrobin detection by LC-MS/MS in strawberry.
Figure 4. (A) The pyraclostrobin-specific mAbs secretory capacity of resuscitated PY-C7 cell line in different monoclonal cell wells. (B) WB results of light or heavy chains of positive and negative monoclonal cell lines.
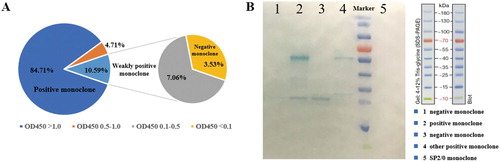
Figure 5. (A) PCR amplification of variable region fragments of PY-C7-mAb with homologous arms. (B) SDS-page of the full-length rAb expressed in mammalian cells HEK293(F). * (A) M’: 5000 KD Marker in actual map; M: standard 5000 KD Marker; (B) M’: 200 KD Marker in actual map; M: standard 200 KD Marker.
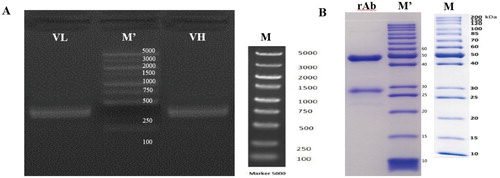
Figure 6. The affinities of PY-C7-mAb and PY-C7-rAb binding pyraclostrobin.
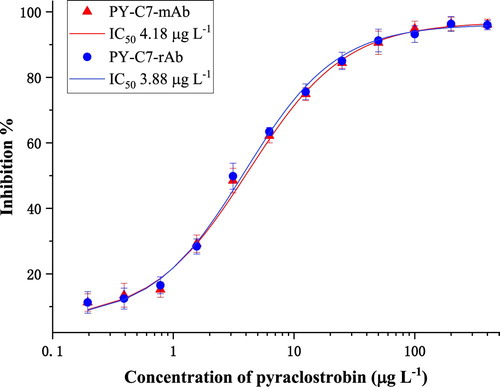
Figure 7. GNPs-mAb/rAb-ICS assay for testing gradient-spiked pyraclostrobin standard solution. * The concentrations of pyraclostrobin standard were, in order, 0, 0.01, 0.02, 0.05, 0.10, 0.20, 0.40 mg L−1.
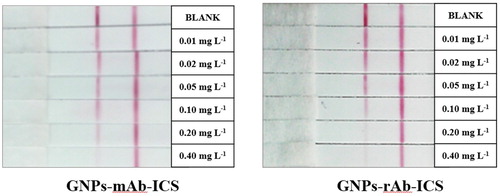
Figure 8. Pyraclostrobin, kresoxim-methyl, azoxystrobin, difenoconazole, each at a concentration of 0.2 mg L−1, were tested by GNPs-ICS assays based on the mAb and the rAb.
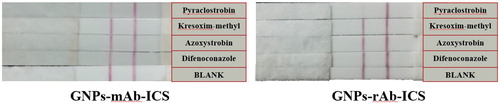
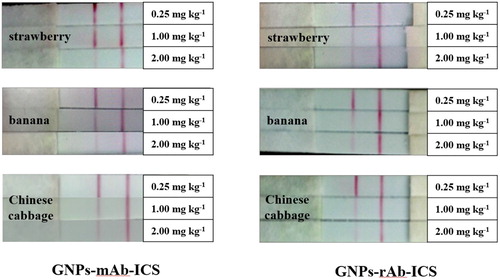
Figure 9. The visual results of recovery tests of pyraclostrobin in strawberry, banana and Chinese cabbage samples detected by GNPs-mAb/rAb-ICS assays.