
Figures & data
Figure 1. The OD value and inhibition ratio of ic-ELISA with three coating antigens and three antibodies from three immunogens. (A) The synthesis of haptens, hapten-conjugations and the process of immunizing mice. (B) The OD value and inhibition ratio were evaluated using the ic-ELISA.
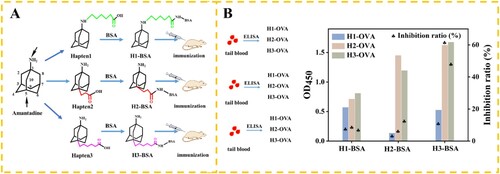
Table 1. Competitive ELISA results with different coating antigens and antibodies
Figure 2. The standard curves of the ic-ELISA for detection of AMD with the five monoclonal antibodies. Each point of inhibition curve represents three replicates.
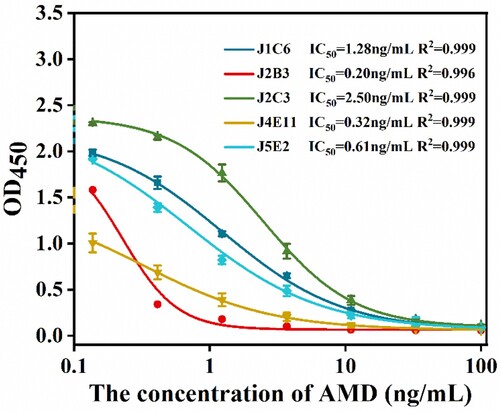
Figure 3. Specificity analysis of the ic-ELISA. The concentrations of amantadine, rimantadine, 1-adamantane carboxylic acid, ribavirin, paracetamol, danofloxacin, and olaquindox in PBS were 100 ng/mL.
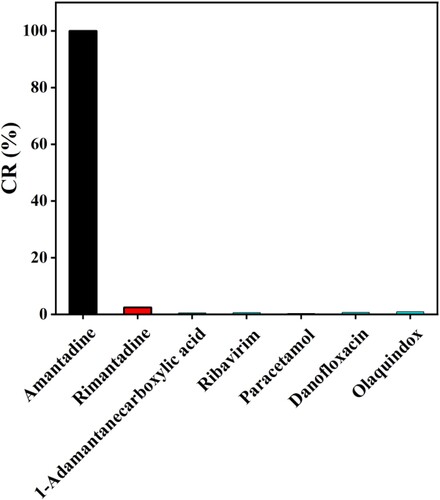
Figure 4. Standard curve of CG-ICA for detection of AMD obtained by plotting the logarithm of B/B0 against the various AMD concentrations. Error bars represent the standard deviation (n = 3).
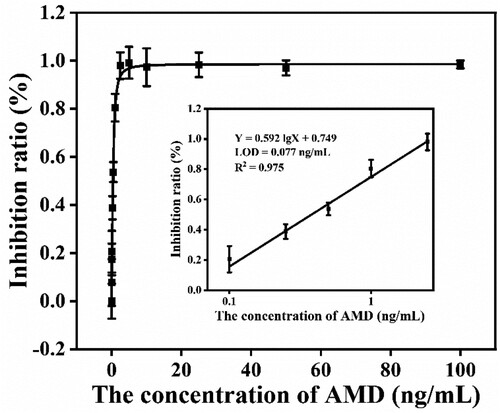
Table 2. Recovery and CV of CG-ICA in chicken samples.
Data availability
The data used to support the findings of this study are included in the article.