Figures & data
Table 1. Concentrations of metal elements in PM2.5 were collected in the South District of Taichung City from August 2017 to May 2018. N.D., not detected.
Figure 1. PM2.5 induces the production of pro-inflammation mediators in MH-S cells. Cells were untreated (mock) or treated with various concentrations of PM2.5 (25, 50 and 100 μg/ml) for 24 h. Then, the cultured media were collected to determine the levels of TNF-α, IL-6, MCP-1 and Rantes using enzyme-linked immunosorbent assay (ELISA). Data are representative of at least three independent experiments and values are expressed in mean ± SD (n ≥ 3). *P < .05 (significant difference compared with mock cells).
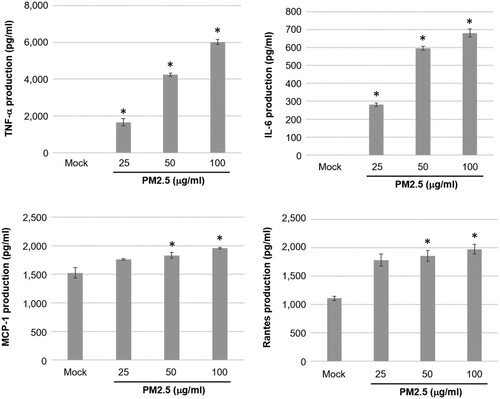
Figure 2. Exposure to PM2.5 induces expressions of iNOS, COX-2 and NFκB in MH-S cells. Cells were untreated (mock) or treated with various concentrations of PM2.5 (12.5, 25, 50 and 100 μg/ml) for 24 h. Then, harvested cell lysates underwent western blotting to detect iNOS, COX-2, NFκB and GAPDH proteins. Data are representative of at least three independent experiments and values are expressed in mean ± SD (n ≥ 3). *P < .05 (significant difference compared with mock cells).
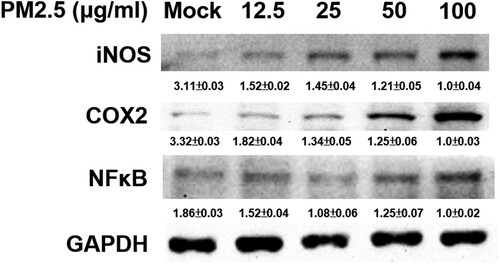
Figure 3. Cell viabilities of MH-S cells treated with various concentrations of luteolin. MH-S cells were treated with various concentrations of luteolin (Lut; 80, 40, 20, 10 and 5 μM) for 24 h. (A) The cell viabilities were measured using a CCK-8 assay and (B) the supernatants of cultures were collected and subjected to LDH assay. Data are representative of at least three independent experiments and values are expressed in mean ± SD (n ≥ 3). *P < .05 (significant difference compared with mock cells).
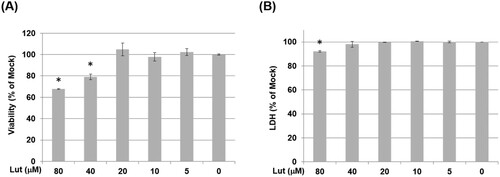
Figure 4. Inhibitory effects of luteolin on the production of inflammatory mediators in PM2.5-exposed MH-S cells. MH-S cells were untreated (mock) or pre-treated with various concentrations of luteolin (5, 10 and 20 μM) for 1.5 h followed by stimulated without (Mock) or with PM2.5 (100 μg/ml). After 24 h, cultured media were collected and analysed using ELISA to determine the levels of (A) TNF-α, (B) IL-6, (C) MCP-1 and (D) Rantes. Data are representative of at least three independent experiments and values are expressed in mean ± SD (n ≥ 3). *P < .05 (significant difference compared with mock cells). N.D., not detected.
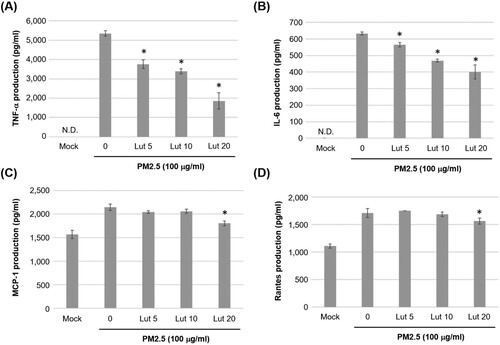
Figure 5. Luteolin inhibits expressions of iNOS, COX-2 and NF-κB in PM2.5-stimulated MH-S cells. MH-S cells were untreated (mock) or pre-treated with various concentrations of luteolin (5, 10 and 20 μM) for 1.5 h, and then untreated (mock) or treated with PM2.5 (100 μg/ml). After 24 h, harvested cell lysates were blotted to detect iNOS, COX-2, NFκB, pNFκB and GAPDH proteins. Data are representative of at least three independent experiments and values are expressed in mean ± SD (n ≥ 3). *P < .05 (significant difference compared with mock cells).
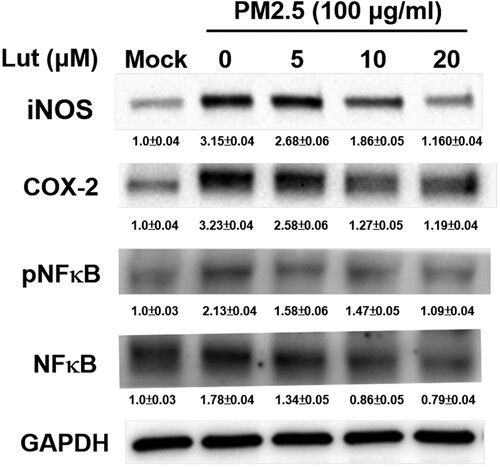
Figure 6. Luteolin inhibits JAK2 and STAT1 but not STAT3 expressions in PM2.5-stimulated MH-S cells. MH-S cells were untreated (mock) or pre-treated with various concentrations of luteolin (5, 10 and 20 μM) for 1.5 h and then untreated (mock) or treated with PM2.5 (100 μg/ml). After 24 h, cell lysates were blotted to detect JAK2, STAT1, STAT3, pJAK2, pSTAT1 and pSTAT3 proteins. Data are representative of at least three independent experiments and values are expressed in mean ± SD (n ≥ 3). *P < .05 (significant difference compared with mock cells).
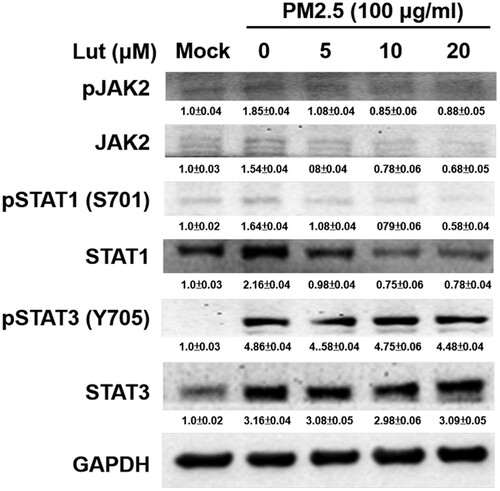
Figure 7. JAK2 inhibitor AG490 reduces the levels of inflammatory mediators in PM2.5-stimulated MH-S cells. MH-S cells were untreated (mock) or pre-treated with JAK inhibitor AG490 (15 μM) for 1.5 h and then untreated (mock) or treated with PM2.5 (100 μg/ml). After 24 h, cultured media were assayed using ELISA to determine levels of (A) TNF-α and IL-6, and (B) cell lysates were blotted to detect iNOS, COX-2, NFκB, pNFκB and GAPDH proteins. Data are representative of at least three independent experiments and values are expressed in mean ± SD (n ≥ 3). *, P < .05 (significant difference compared with untreated cells).
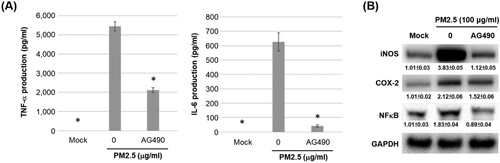
Figure 8. HO-1 expression is enhanced by luteolin and JAK inhibitor AG490 treatments. (A) Induction of HO-1 expression by PM2.5 (25, 50 and 100 μg/ml) for 24 h. (B) MH-S cells were untreated (mock) or pre-treated with various concentrations of luteolin (5, 10 and 20 μM) or (C) JAK inhibitor AG490 (15 μM) for 1.5 h following stimulated with PM2.5 (100 μg/ml). After 24 h, cell lysates were blotted to detect HO-1 and GAPDH protein expressions. Data are representative of at least three independent experiments and values are expressed in mean ± SD (n ≥ 3). *, P < .05 (significant difference compared with mock cells).
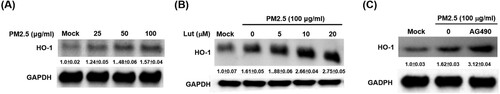
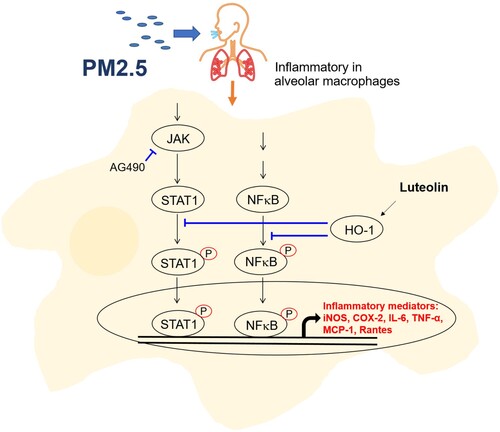
Figure 9. Proposed role of luteolin in regulating inflammatory responses in PM2.5-stimulated alveolar macrophage MH-S cells. Proposed role of luteolin in regulating inflammatory responses in PM2.5-stimulated alveolar macrophage MH-S cells.