Figures & data
Figure 1. Effects of CZL extract treatment on histological change in PM10-treated mice lung tissue. Representative histological sections of lung tissue processed through H&E staining. Red arrows point to inflammatory cell infiltration. Scale bars of 100 μm represent the magnification of 200×.
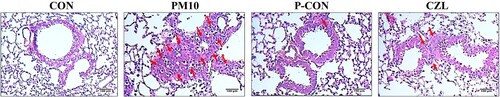
Figure 2. Effects of CZL extract treatment on inflammatory protein expression in PM10-treated mice (A, B) and A549 cells (C). Data are expressed as the mean ± SD. Statistical significance was calculated using one-way ANOVA followed by Dunnett’s post-hoc test. *p< 0.05; **p< 0.01 vs. PM10 group.
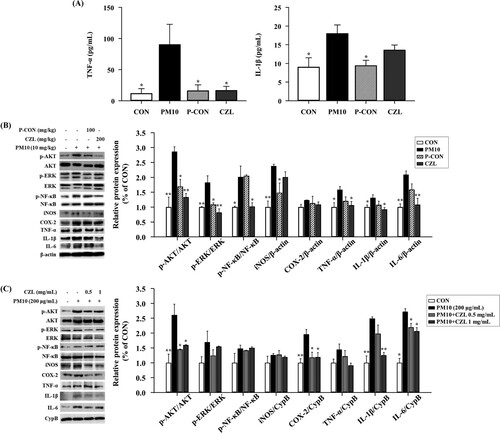
Figure 3. Effects of CZL extract treatment on NO release (A) and inflammatory protein expression (B) in LPS-treated RAW264.7 macrophage. Data are expressed as the mean ± SD. Statistical significance was calculated using one-way ANOVA followed by Dunnett’s post-hoc test. *p< 0.05; **p< 0.01; ***p< 0.001 vs. LPS group.
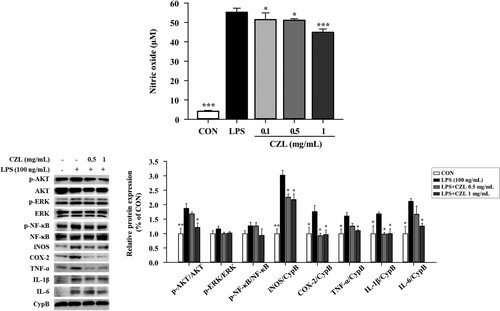
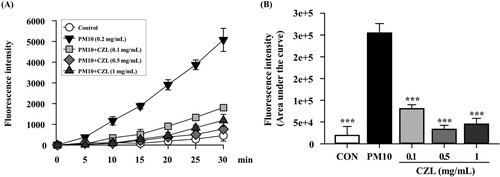
Figure 4. Effects of CZL extract treatment on intracellular levels of ROS (A, B) in PM10-treated A549 cells. Data are expressed as the mean ± SD. Statistical significance was calculated using one-way ANOVA followed by Dunnett’s post-hoc test. ***p< 0.001 vs. PM10 group.