Figures & data
Table 1. The major nutritional and functional components of banana powder products.
Table 2. The PCR primer sequence, size, and annealing temperature of selected gut microbiota of Lactobacillus, Bifidobacterium, Enterococcus, Enterobacteria, and Bacteroides.
Figure 1. Effects of banana powder intervention on body weight, food intake, water intake and urine output in normal control group of non-diabetic rats (NCG), standard chow (SCG), and low (LDG), middle (MDG), and high dose (HDG) of banana starch intervention diabetic rats. (A) Bodyweight; (B) Food intake; (C) Water intake; (D) Urine output.
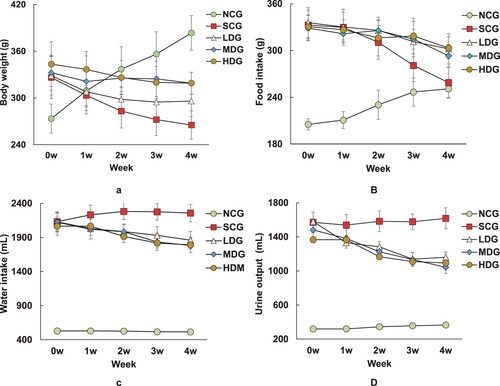
Figure 2. Effect of banana starch diet on fasting blood glucose (FBG) of normal control group of non-diabetic rats (NCG), standard chow (SCG), and low (LDG), middle (MDG), and high dose (HDG) of banana starch intervention diabetic rats. (A) FBG levels in each rat group during 4 weeks of experiments; (B) The area under the FBG curve for each group; (C) The oral glucose tolerance test results of each group within a period of 120 min experiments.
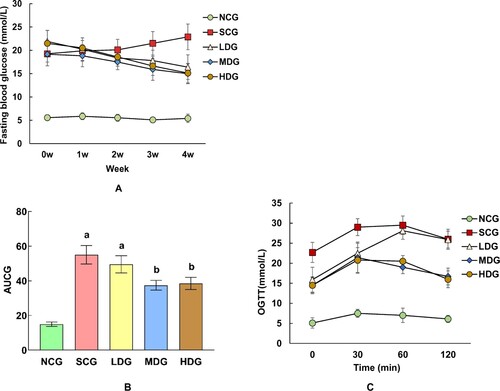
Table 3. Effect of Banana starch on blood insulin and cholesterol levels of normal control non-diabetic rats (NCG), standard chow diabetic rats (SCG), low dose of banana starch diabetic rats (LDG), middle dose of banana starch rats (MDG), and high dose of banana starch diabetic rats (HDG).
Figure 3. HE staining imaging of rat pancreatic tissues from normal control group of non-diabetic rats (NCG), standard chow (SCG), and low (LDG), middle (MDG), and high dose (HDG) of banana starch intervention diabetic rats.
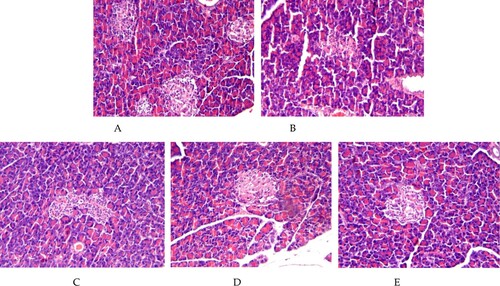
Table 4. Effect of Banana starch on liver levels of SOD, MIDA,Free fat acid, total bilirubin, LDH, AST, ALT, TP, ALB, HK, PK, MIDH, SDH, G-6-P in normal control non-diabetic rats (NCG), standard chow diabetic rats (SCG), low dose of banana starch diabetic rats (LDG), middle dose of banana starch rats (MDG), and high dose of banana starch diabetic rats (HDG).
Figure 4. HE staining imaging of rat hepatic tissues from normal control group of non-diabetic rats (NCG), standard chow (SCG), and low (LDG), middle (MDG), and high dose (HDG) of banana starch intervention diabetic rats.
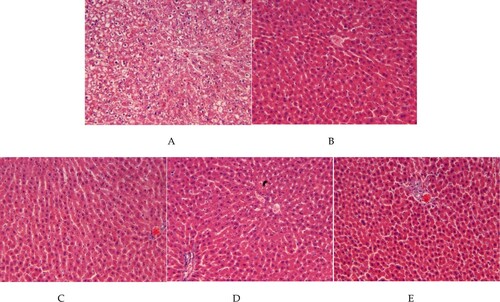
Table 5. Effect of Banana starch on gut levels of maltase, sucrase, a-amylase, SCFA, pH in normal control non-diabetic rats (NCG), standard chow diabetic rats (SCG), low dose of banana starch diabetic rats (LDG), middle dose of banana starch rats (MDG), and high dose of banana starch diabetic rats (HDG).
Table 6. Effect of Banana starch on gut SCFA levels of acetic acid, propionic acid, and butyrate in normal control non-diabetic rats (NCG), standard chow diabetic rats (SCG), low dose of banana starch diabetic rats (LDG), middle dose of banana starch rats (MDG), and high dose of banana starch diabetic rats (HDG).
Table 7. Effect of banana starch on gut microbiota growth of Lactobacillus, Bifidobacterium, Enterococcus, Enterobacteria, and Bacteroides in normal control non-diabetic rats (NCG), standard chow diabetic rats (SCG), low dose of banana starch diabetic rats (LDG), middle dose of banana starch rats (MDG), and high dose of banana starch diabetic rats (HDG).
Figure 5. Effect of banana powder intervention on mental behaviours in normal control group of non-diabetic rats (NCG), standard chow (SCG), and low (LDG), middle (MDG), and high dose (HDG) of banana starch intervention diabetic rats. (A) Comparison of exhaustive swimming time in each group, (B) Comparison of the behaviours of Immobility Behaviour Counting (IBC), Swimming Behaviour Counting (SBC), Cumulative Immobility Counting (CBC) in each group in the forced swimming test. (C) Comparison of the behaviours of AFT and MSRT in each group in the tail suspension test.
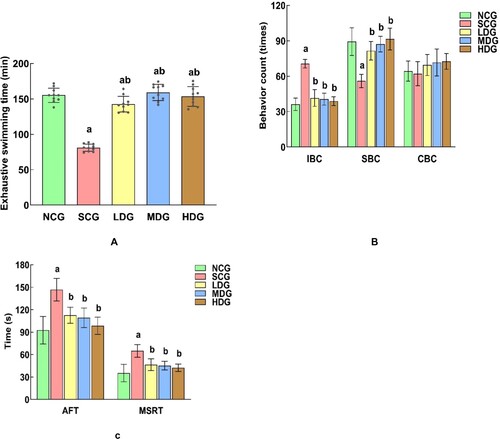
Table 8. Effect of Banana starch on depressive-like behaviours of exhausting swimming, forced swimming and tail suspension tests in normal control non-diabetic rats (NCG), standard chow diabetic rats (SCG), low dose of banana starch diabetic rats (LDG), middle dose of banana starch rats (MDG), and high dose of banana starch diabetic rats (HDG).
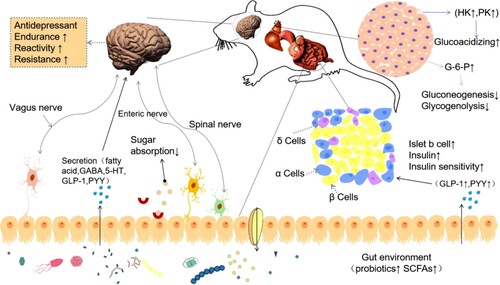
Figure 6. The proposed mechanism diagram of banana starch intervention attenuates diabetes-induced depressive-like behaviours via modulation of the gut-microbiota-brain axis.