Figures & data
Figure 1. The effects of antioxidant concentration on the inhibition of the ABTS (A), OH (B), and DPPH (C) in VA (VA) and the effect of VA on body weight (D), thymus index (E), spleen indices (F) in immunosuppressed mice.
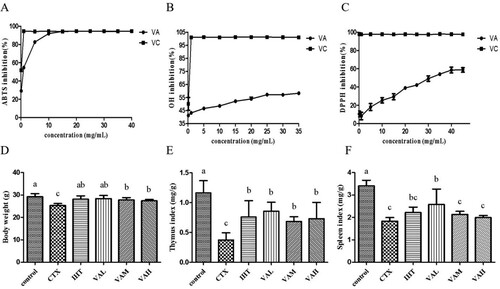
Figure 2. Effects of VA on delayed-type hypersensitivity to SRBC (A); proliferation response of splenic lymphocytes to ConA (B); NK cell activity (C); macrophage phagocytosis by carbon clearance assay (D); leukocyte count (E).
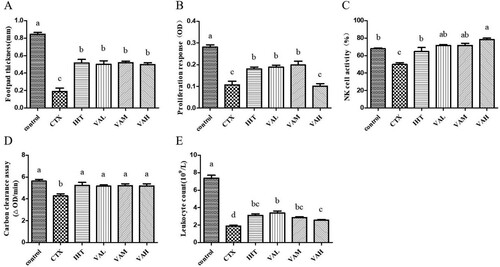
Figure 3. Effect of VA on the CD4- CD8+% (A), CD4 + CD8+% (B), CD4-CD25+% (C), and CD4- CD25-% (D) and the serum levels of TNF-α (E); IFN-γ (F); IL-12 (G); IL-4 (H).
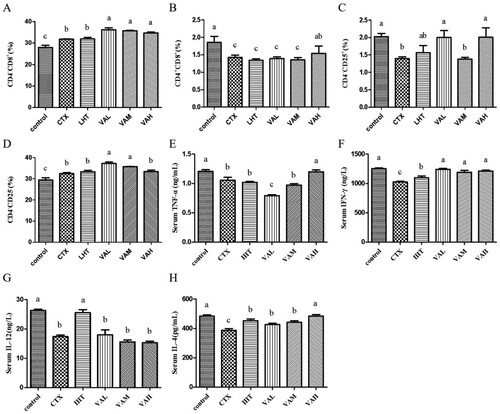
Figure 4. Splenic T lymphocyte subpopulations of control group(A), CTX group(B), VAL group(C), VAM group(D), VAH group(E) by flow cytometry.
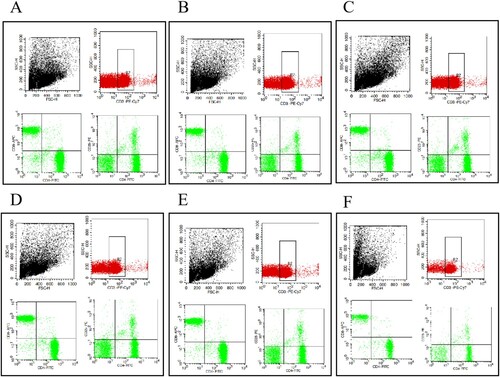
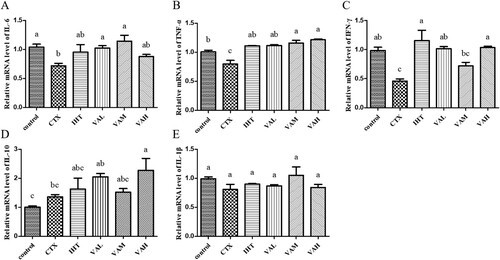
Figure 5. Effect of VA on the mRNA level of IL-6 (A); TNF-α (B); IFN-γ (C); IL-10 (D); IL-1β (E).