
Figures & data
Figure 1. Schematic illustration of the TRFIA system. (a) Sample pretreatment and components of a TRFIA test strip. Tobacco leaves were roughly cut and mixed with extraction buffer. One-hundred microliters of supernatant were applied onto the sample pad, and the fluid flowed along the strip driven by capillary action. (b) In the absence of TMV, Eu3+-detection mAb only accumulated on the C line, resulting in a signal on the C line. (c) Detection mode in the presence of TMV, Eu3+-detection mAb accumulated on the T line and C line, both lines showed signals. (d) The test strip was incubated for 10 min at room temperature, until when the fluorescent signal was read using a portable fluorometer.
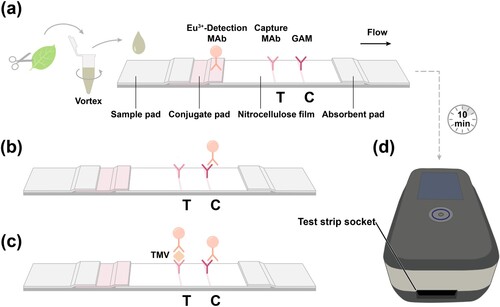
Figure 2. Titration of mAb 1, 2, and 3 against homogenised TMV-infected tobacco leaves was detected using indirect competitive ELISA.
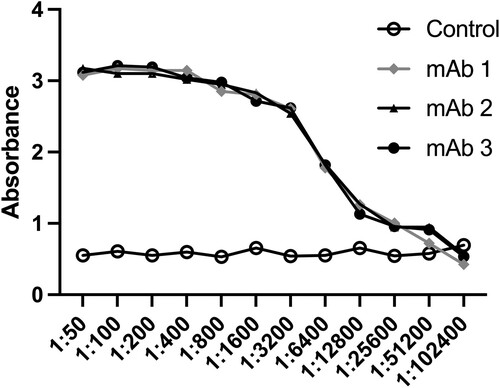
Table 1. mAb pair screening.
Figure 3. Performance and evaluation of TMV TRFIA. (a) Immunological kinetics of the TRFIA test strip. (b) Standard curve of T/C value versus TMV concentration in the range of 0∼317 ng/mL. (c) Standard curve of T/C values versus TMV concentrations in the range of 0∼35 ng/mL. Data are presented as mean ± SD from three measurements. (d) Specificity of test strips. Test strips from left to right characterise the detection results of TMV, CMV, Poty, PVX, PVY, TEV, TRSV, TSWV, A. longipes, P. nicotianae, and R. solanacearum.
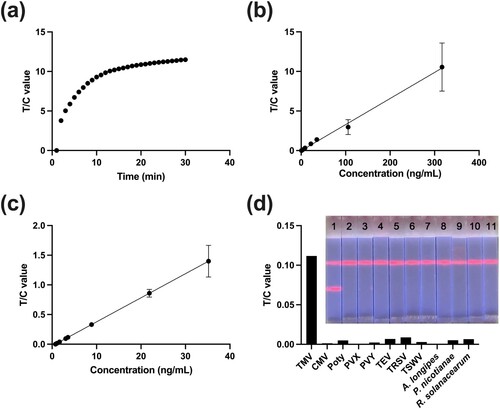
Table 2. Intra-day and inter-day precision.
Table 3. Recovery of TMV in spiked tobacco samples.
Figure 4. Comparative evaluation of TRFIA with colloidal gold LFA and RT-PCR, and assessment of field applicability. (a) Representative results of a TRFIA test strip and a colloidal gold strip. (b) Sensitivity of RT-PCR in the detection of TMV. The assay included duplicate reactions for each dilution. NC was the non-template control without cDNA.
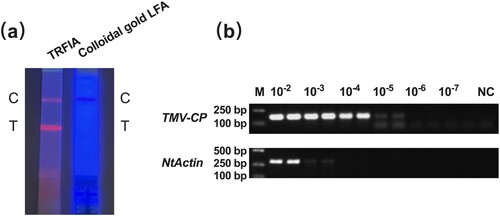
Table 4. Descriptive statistics of field-collected samples.