
Figures & data
Table 1. Contents of extracellular polysaccharides in intracellular samples.
Figure 1. UV spectra of IPS(A) and EPS(B); Infrared spectra of IPS(C) and EPS(D).
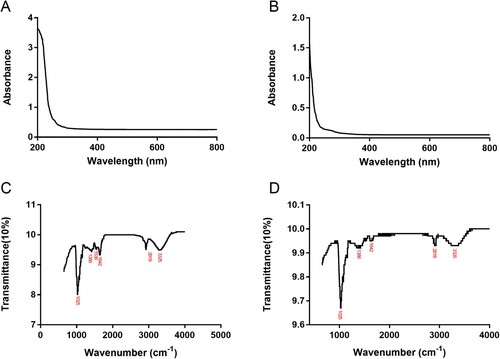
Figure 2. Determination of antioxidant capacities of IPS, EPS and VC in vitro. A, DPPH• scavenging effects; B, •OH free radicals scavenging effects; C, Fe2+ chelating abilities; D, reduction capabilities. VC, namely ascorbic acid, was chosen as the positive control. Results were expressed as the mean ± SD(n = 3).
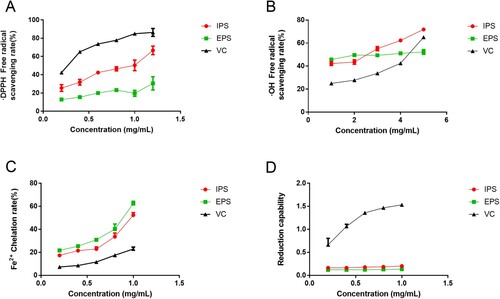
Figure 3. Cytotoxicity determination. A, cell viabilities of IPS; B, cell viabilities of EPS; D, cell viabilities of VC; D, cell viabilities of H2O2; E, the status of human fibroblasts on different concentrations of H2O2. VC was chosen as the positive control. ##p < 0.01, #p < 0.05, in A∼ D, compared with the sample at the concentration of 0.
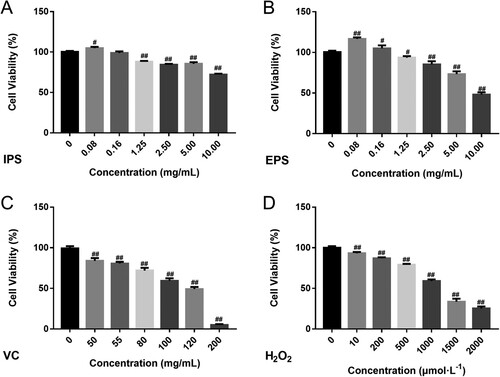
Figure 4. The fluorescence intensity photo of ROS (A, B) and in HSF cells. The Intracellular antioxidant activities of different samples on ABTS scavenging capacities(C), the total SOD activities (D) and MDA contents(E). The control group did not do any treatment, and the model group was stimulated with H2O2. IPS and EPS represent the cells treated respectively by the intracellular and extracellular polysaccharides at the concentration of 2.5 mg/mL. VC at the concentration of 55μg/mL is chosen as the positive control. ##p < 0.01, compared with Control group; *p < 0.05, **p < 0.01, compared with Model group, $p < 0.05, $$p < 0.01, compared with VC.
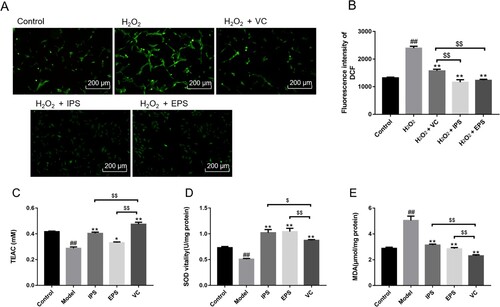
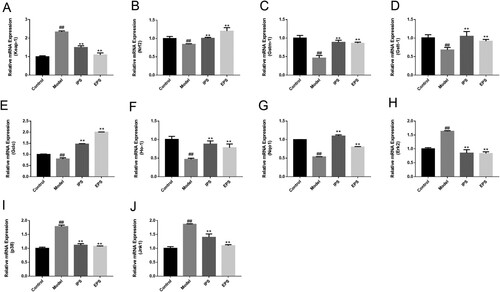
Figure 5. The relative expression of anti-aging related genes. Keap1(A), Nrf2(B), Gstm-1(C), Gstt-1(D), Gclc(E), Ho-1(F), Nqo1(G), Erk2(H), p38(I) and Jnk1(J). IPS and EPS represent the cells treated respectively by the intracellular and extracellular polysaccharides at the concentration of 2.5 mg/mL, ##p < 0.01, compared with Control group; **p < 0.01, compared with Model group.
Supplemental Material
Download MS Word (309.6 KB)Data availability statement
The data used and/or investigated during the present study are available from the corresponding author upon reasonable request.