
Figures & data
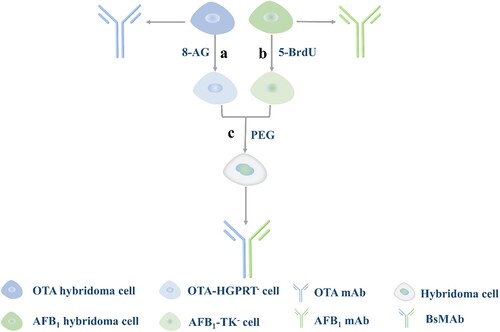
Figure 1. Process of BsMAb generation by hybrid-hybridoma technology. (a) OTA hybridoma cells were mutagenized with different concentration gradients of 8-AG. (b) AFB1 hybridoma cells were mutagenized with different concentration gradients of 5-BrdU. (c) Tetrasomal hybridoma cells were obtained by fusing the OTA-HGPRT– cell and AFB1-TK– cell.
Scheme 1. Schematic illustration of the BsMAb-based QB-LFIA for the simultaneous detection of OTA and AFB1. (A) Composition of test strip. (B) Structure of BsMAb. (C) Principle of the BsMAb-based QB-LFIA. (D) Interpretation of different test results.
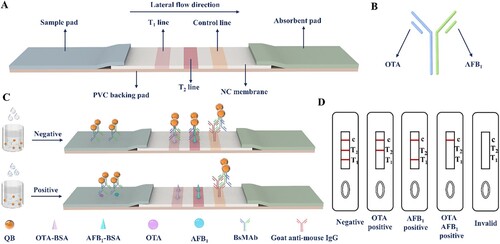
Figure 2. Characterization of BsMAb. (A) Standard curve for BsMAb detection of OTA. (B) Standard curve for BsMAb detection of AFB1. (C) Subtype of BsMAb. (D) SDS-PAGE of BsMAb.
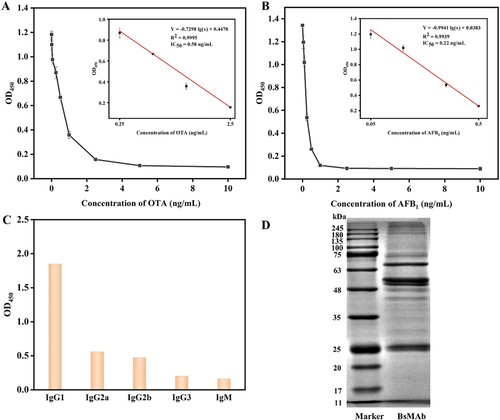
Figure 3. Characterization of QB and QB-BsMAb probe. (A) TEM image of individual QB at high magnification. (B) High-resolution TEM image of the QB. (C) Hydrodynamic diameter variations of QB and QB-BsMAb probe. (D) Zeta potential values of QB and QB-BsMAb probe.
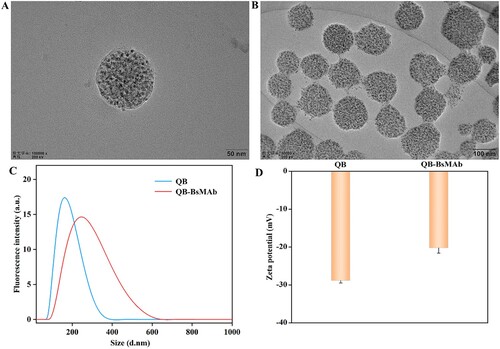
Figure 4. Optimization of the key parameters of the BsMAb-based QB-LFIA. (A) Labelling pH (4.0, 4.5, 5, 5.5, and 6.0). (B) Amount of BsMAb (9.0, 10.0, 11.0, 12.0, and 13.0 µg). (C) Amount of EDC (10, 20, 30, 40, and 50 µg). (D) Volume of QB-BsMAb probe (1.0, 1.5, 2.0, 2.5, and 3.0 µL). (E) Concentration of OTA-BSA (0.5, 0.6, 0.7, 0.8, and 0.9 mg/mL). (F) Concentration of AFB1-BSA (0.6, 0.7, 0.8, 0.9, and 1.0 mg/mL). (G) Immunological kinetic curve of OTA. (H) Immunological kinetic curve of AFB1.
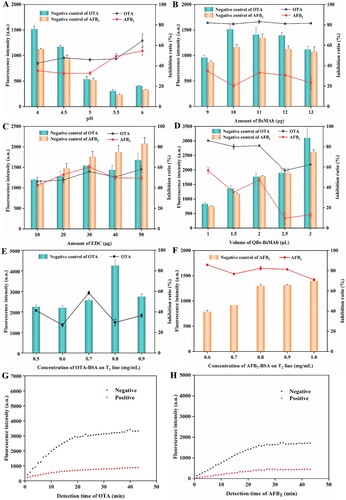
Figure 5. Standard curves of the BsMAb-based QB-LFIA for the simultaneous detection of OTA and AFB1 in PBS and cereal samples. (A) PBS spiked with OTA. (B) Soybean spiked with OTA. (C) Corn spiked with OTA. (D) Rice spiked with OTA. (E) PBS spiked with AFB1. (F) Soybean spiked with AFB1. (G) Corn spiked with AFB1. (H) Rice spiked with AFB1.
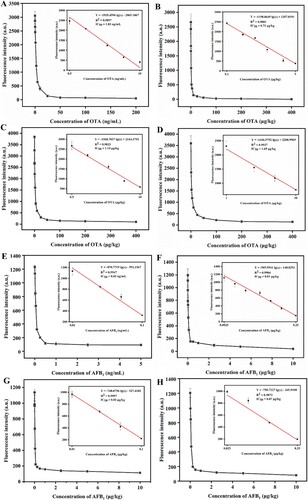
Table 1. Calibration curves of the BsMAb-based QB-LFIA for the analysis of OTA and AFB1.
Figure 6. Specificity and stability of the BsMAb-based QB-LFIA. (A) Specificity of the BsMAb-based QB-LFIA. Stability results of (B) OTA and (C) AFB1.
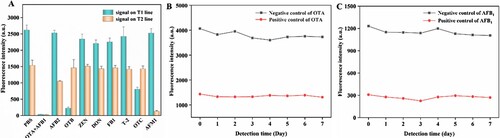
Table 2. Results of recovery experiment (n = 3).
Figure 7. Standard curves of the OTA-based QB-LFIA and AFB1-based QB-LFIA in PBS and cereal samples. (A) PBS spiked with OTA. (B) Soybean spiked with OTA. (C) Corn spiked with OTA. (D) Rice spiked with OTA. (E) PBS spiked with AFB1. (F) Soybean spiked with AFB1. (G) Corn spiked with AFB1. (H) Rice spiked with AFB1.
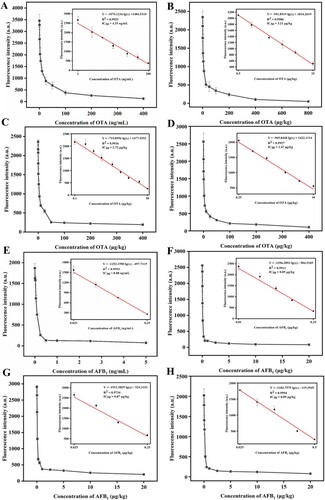
Table 3. Contrast of sensitivity in the proposed method for OTA and AFB1 detection compared with traditional OTA-based QB-LFIA and AFB1-based QB-LFIA.