
Figures & data
Table 1. Orthogonal test to optimise fermentation conditions L9 (34).
Table 2. Concentration of lactic acid bacteria in minced shrimp at different fermentation times.
Table 3. Comparative assessment of supernatant and precipitate allergens of fermented shrimp.
Table 4. Orthogonal test results of L. helveticus TS6024 fermentation.
Table 5. L. helveticus TS6024 fermentation temperature and time.
Table 6. Orthogonal test results of L. acidophilus 6005 fermentation.
Table 7. L. acidophilus 6005 fermentation temperature and time.
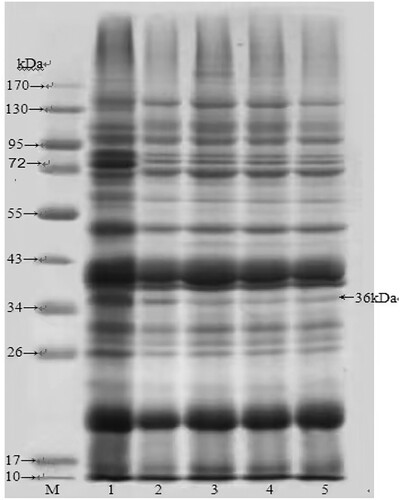
Figure 1. SDS-PAGE analysis on the degradation effects of L. helveticus TS6024- and L. acidophilus 6005-fermentation on TM molecules. M, marker; lane 1, protein extracts from unfermented shrimp; lane 2, protein extracts from the precipitate of L. acidophilus 6005-fermentation, OD492nm: 0.175; lane 3, protein extracts from the supernatant of L. acidophilus 6005-fermentation, OD492nm: 0.145; lane 4, protein extracts from the precipitate of L. helveticus TS6024-fermentation, OD492nm: 0.123; lane 5, protein extracts from the supernatant of L. helveticus TS6024-fermentation, OD492nm: 0.107.
Data availability statement
Data can be made available upon reasonable request.