Figures & data
Table 1. The sequences of the primers for real-time PCR.
Figure 1. Electrophoresis of total RNA detection (M, Marker; 1∼3, Control group; 4∼6, EAE group; 7∼9, EAS group; 10∼12, rh-EGF Group).
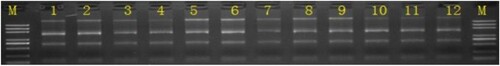
Table 2. RNA quality assessment.
Table 3. Statistics and quality estimation of RNA-seq reads.
Figure 2. (A) TPM number distribution violin illustration. (B) Different treatment group expression between sample quantity PCA analysis. (C) Venn diagram of differentially expressed genes.
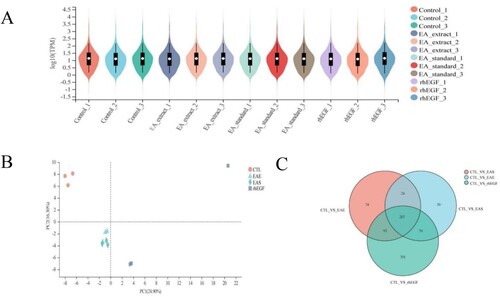
Figure 3. Volcano map of differentially expressed genes between different groups. (A) CTL_VS_EAE, (B) CTL_VS_EAS, (C) CTL_VS_rh-EGF.
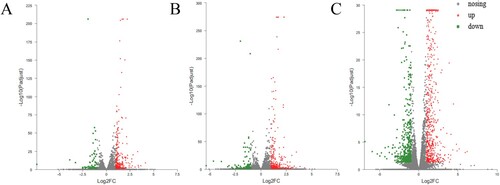
Figure 4. GO classification statistics. (A) CTL_VS_EAE, (B) CTL_VS_EAS, (C) CTL_VS_rh-EGF.
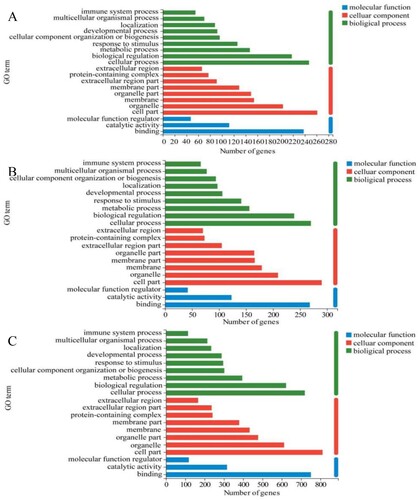
Figure 5. GO function annotation and function enrichment analysis. (A) CTL_VS_EAE, (B) CTL_VS_EAS, (C) CTL_VS_rh-EGF.
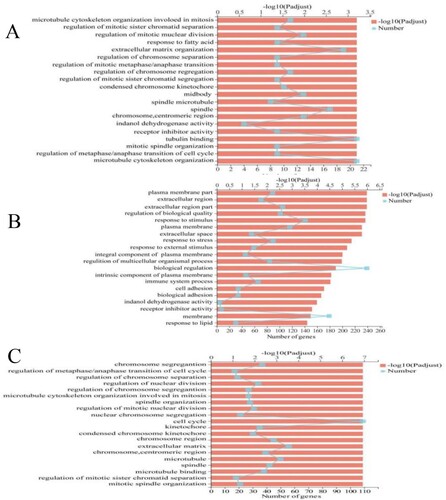
Figure 6. KEGG enrichment analysis bubble chart of different treatment groups. (A) CTL_VS_EAE (B) CTL_VS_EAS, (C) CTL_VS_rh-EGF.
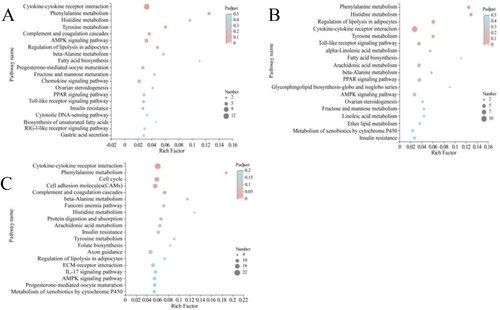
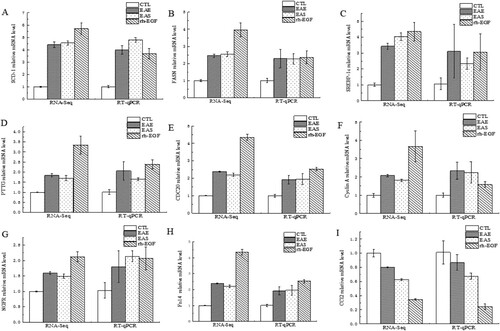
Figure 7. Comparison of RNA-Seq and RT-qPCR gene expression levels. (A) SCD-1 (B) FASN (C) SREBP-1c (D) PTTG (E) CDC20 (F) Cyclin A (G) NGFR (H) Fn14 (I) CCL2.