Figures & data
Scheme 1. Sample preparation scheme.
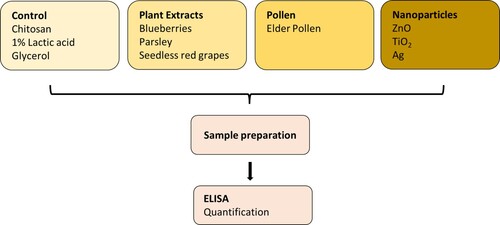
Table 1. Crustacean protein content in µg/g for individual packaging types with the addition of plant extracts and elder pollen.
Figure 1. Graphical representation of crustacean protein content as a function of the addition of bioactive substances.
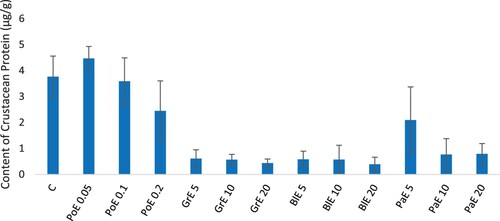
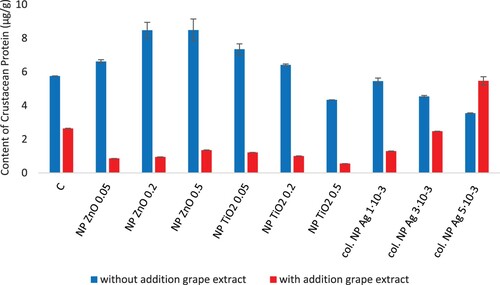
Table 2. Crustacean protein content in µg/g for individual packaging types with and without the addition of grape extract.
Figure 2. Crustacean protein content depending on the addition of ZnO NPs, TiO2 NPs, col. AgNPs and grape extract.