
Figures & data
Figure 1. (a) The effect of cell viability sodium butyrate (NaB) in the BV-2 cells, (b) the effect NaB on cell viability in LPS-induced BV-2 cells, and (c) NO production against in LPS-induced BV-2 cells. Histograms were presented as mean ± SD, where n = 3. The p-value is determined by ANOVA with Tukey’s multiple test comparison and p-value less than 0.05 was expressed as statistically significant. *p < 0.05, **p < 0.001, and ***p < 0.0001 compared to the only TNF-α-treated group.
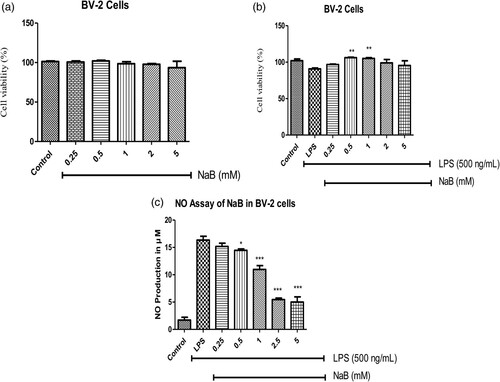
Figure 2. The effect of NaB on tau phosphorylation in the TNF-α-induced SH-SY5Y cells and LPS-induced BV-2 cells, respectively. Histograms were presented as mean ± SD, where n = 3. The p-value is determined by ANOVA with Tukey’s multiple test comparison and p-value less than 0.05 was expressed as statistically significant. *p < 0.05, **p < 0.001, and ***p < 0.0001 compared to the only TNF-α-treated group.
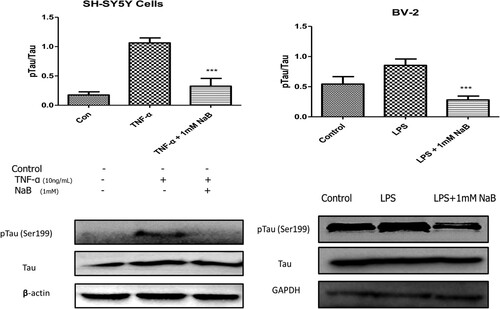
Figure 3. The effect of NaB on the expression of APP, BACE, and Aβ in the TNF-α-induced SH-SY5Y cells. Histograms were presented as mean ± SD, where n = 3. The p-value is determined by ANOVA with Tukey’s multiple test comparison and a p-value less than 0.05 was expressed as statistically significant. Where *p < 0.05, **p < 0.001, and ***p < 0.0001 compared to the only TNF-α-treated group.
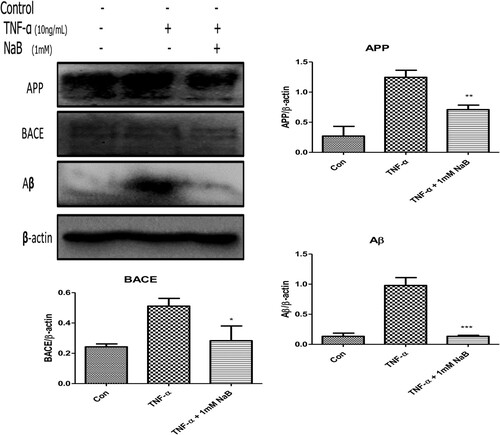
Figure 4. The effect of NaB on cell viability, apoptotic, and APP, BACE protein expressions in the aggregated Aβ(25–35)-induced SH-SY5Y cells. Histograms were presented as mean ± SD, where n = 3. The p-value is determined by ANOVA with Tukey’s multiple test comparison and p-value less than 0.05 was expressed as statistically significant. *p < 0.05, **p < 0.001, and ***p < 0.0001 compared to the only Aβ-treated group.
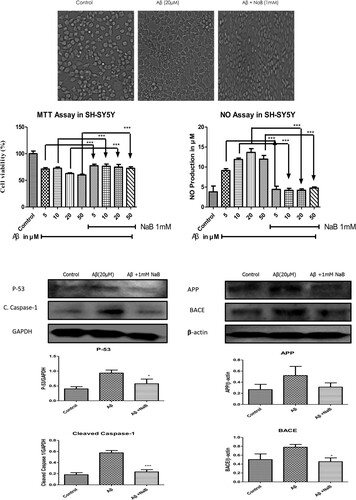
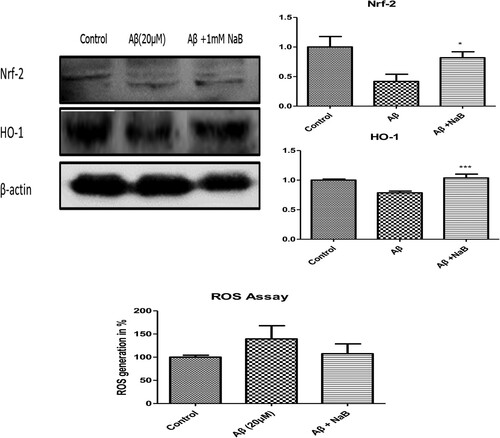
Figure 5. The effect of NaB on Nrf-2 and HO-1 protein expressions and ROS production in the aggregated Aβ(25–35)-induced SH-SY5Y cells. Histograms were presented as mean ± SD, where n = 3. The p-value is determined by ANOVA with Tukey’s multiple test comparison and p-value less than 0.05 was expressed as statistically significant. *p < 0.05, **p < 0.001, and ***p < 0.0001 compared to the only Aβ-treated group.