Figures & data
Figure 1. Seed germination and metabolic analysis through HPLC-MS/MS. (a) Phenotype of the un-germination seed (CK) and the germination seed (DX). (b) Typical ion chromatograms (TIC) of seed metabolomics at different developmental stages. The total ion flow chromatography is a continuous scanning of the component of the separation of the flow of the chromatographic spectrum, and the mass spectrometry is collected by the continuous scanning of the mass spectrum, and each scan is obtained by a mass spectrograph, which is added to all the ions in each mass spectrum, and obtains a total ionic flow intensity. And then the ion intensity is the column coordinate, the time is the horizontal coordinate, the draw is made. (c) Principal Component Score (PCA) analysis of metabolome sequencing results. The X-axis represents the first principle component (PC1), and the Y-axis represents the second principal component (PC2). PC1 explains 76.2% variance distinguishing genotypes from different time points, and PC2 explains 9.53% variance is distinguishing genotypes based on biological replications. (d) Orthogonal projections to latent structures- discriminant analysis (OPLS-DA) results and S-plot score. The X-axis represents the first principle component (PC1), and the Y-axis represents the second principal component (PC2). PC1 explains 72% variance distinguishing genotypes from different time points, and PC2 explains 9.45% variance is distinguishing genotypes based on biological replications.
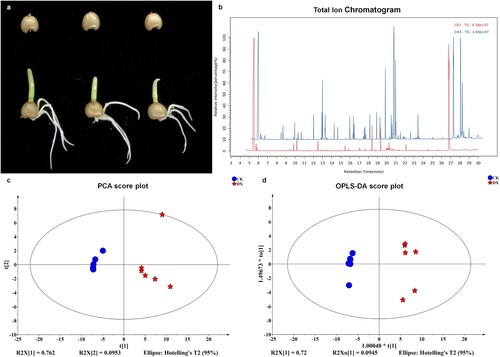
Figure 2. Statistical description of metabolic analysis of coix seed germination.
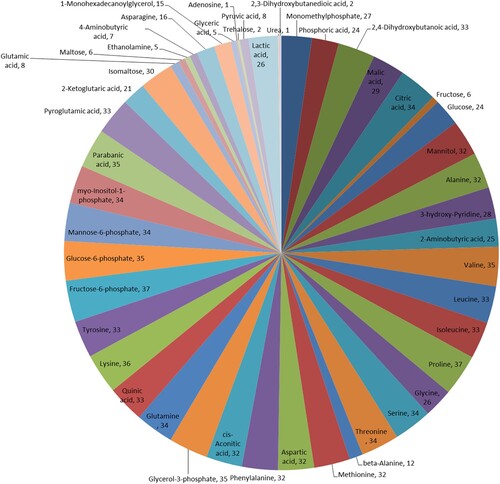
Figure 3. Untargeted metabolome profiling after the seed germination. (a) The unsupervised hierarchical cluster analysis for untargeted metabolomic profiles. The dendrogram was built based on the fold change (p < 0.05, VIP > 1, and log2FC > 1.50) heat map. The rows in the heat map indicate metabolites, and the columns represent groups/samples. The colors of heat map cells represent the scaled expression level of metabolites among different groups. The color gradient, ranging from green to black through red, indicates the low, high, and middle values of metabolite expression. Colors of different groups represent the biological replicates at two different time points. The green dot in the figure represents the down regulated differential expression metabolite, the red dot represents the up regulated differential expression metabolite, and the black dot represents the detected but insignificant metabolite. (b) Metabolite association analysis of coix seed germination. Each circle represents various metabolites, and the line between them represents the significant correlation between metabolites and metabolites, among which red represents positive correlation, blue represents negative correlation.
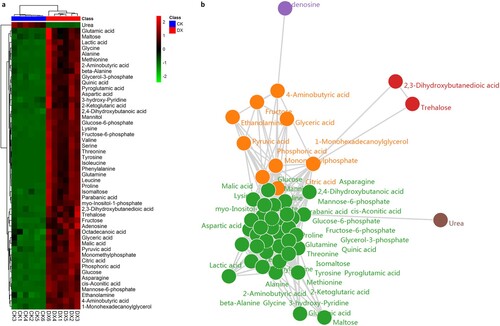
Figure 4. Gene expression analysis during the seed germination, generated using high-throughput RNA-seq. (a) Venn diagram for genes between germination seed (C2) and control (C1). (b) Identification of differentially expressed genes (DEGs) between treatments, generated using high-throughput deep sequencing technology. The volcano plot presents the expression of the DEGs in different treatments, the red dots represent up-regulated genes, and the green dots represent down-regulated genes. (c) The KEGG pathways of all DEGs of germination seeds and controls. The abscissa is the percent of differentially expressed genes in different KEGG, and the ordinate is the type of KEGG enrichment.
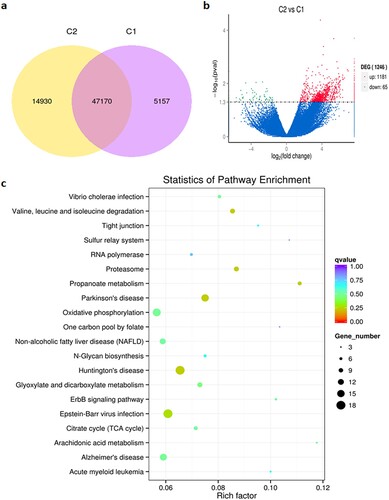
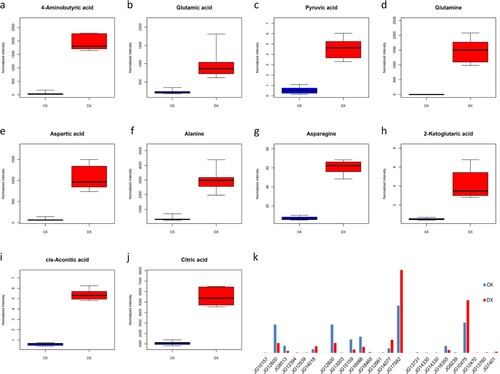
Figure 5. Differential metabolites and differentially expressed genes related to GABA synthesis pathway. (a–j) In the box plot, the abscissa represents the sample and the ordinate represents the enrichment content for the differentially enriched metabolites. Blue is the test result of non-germinated seeds, and red is the test result of germinated seeds. (k) The column chart is about differentially expressed genes. The abscissa represents the gene name and the ordinate represents the expression amount. Blue is the test result of non-germinated seeds, and red is the test result of germinated seeds.