
Figures & data
Figure 1. Schematic representation of the DNA extraction method based on the microneedle patches compared with commercial kits.
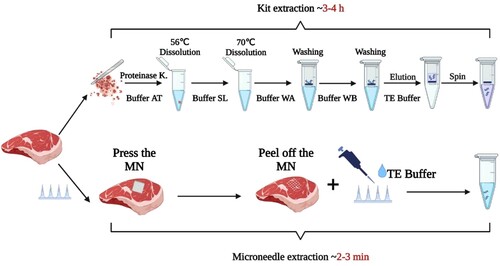
Figure 2. Preparation process of PMVE/MA microneedle patches.
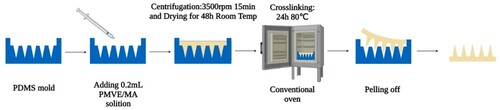
Figure 3. Morphological diagram of the differently fabricated microneedle patches. (A) PVA microneedle patch, (B) PMVE/MA microneedle patch with 3% NaHCO3 incorporation, (C) PMVE/MA microneedle patch with Carbopol® 974P incorporation, (D) Needle morphology of the PMVE/MA microneedle patch with 3% NaHCO3 incorporation.
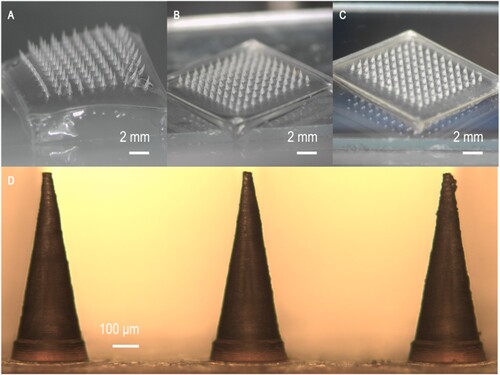
Figure 4. Swelling ability of the differently fabricated microneedle patches. (A) Swelling rate of PMVE/MA microneedle patches supplemented with different concentrations of NaHCO3 (n = 3), (B) Swelling rate of PMVE/MA microneedle patches supplemented with Carbopol® 974P (n = 3), (C) Swelling ability of PMVE/MA microneedle patches with 3% NaHCO3 for 10 min (n = 3).
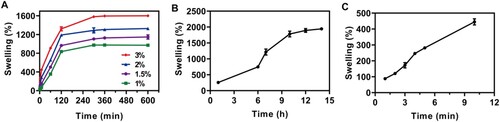
Figure 5. Morphology of the microneedle patches before and after penetration during DNA extraction. (A–B) Sample morphology after the microneedle patch was inserted into the meat and pulled out, (C–D) Morphology of microneedle patch after insertion into the meat and subsequent extraction.
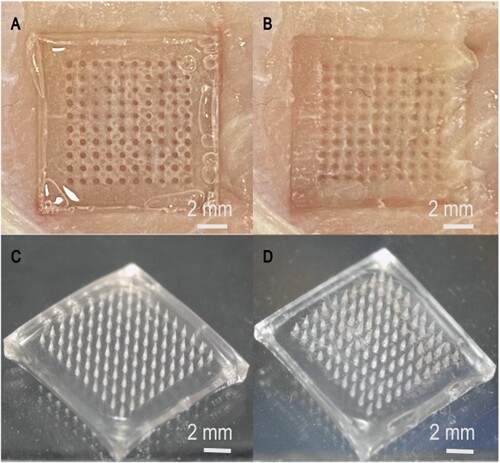
Figure 6. The UV absorption spectra of the samples extracted by the commercial kit and microneedle patches from (A) Mutton, (B) Pork, (C) Duck, (D) Chicken (n = 3).
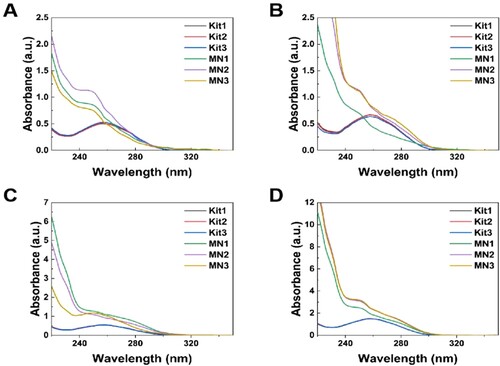
Figure 7. The sample amount (mg) and DNA per mg (ng/mg) extracted from each meat by using two different methods. (A) Mutton, (B) Pork, (C) Duck, (D) Chicken (n = 3).
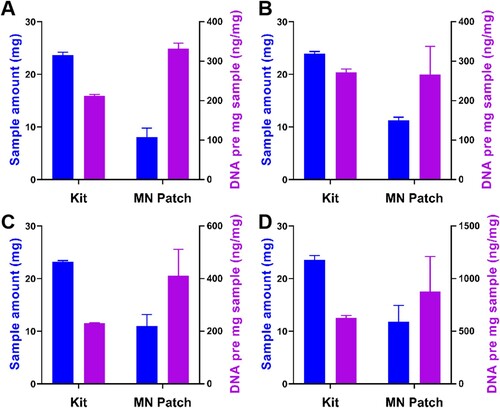
Figure 8. Qualitative and quantitative analysis of mutton, pork, duck, and chicken DNA. Gel electrophoresis plots showing the amplified bands of (A) mutton (B) pork (C) duck (D) chicken. Lanes 1–3: DNA extracted from the microneedle patch, lane 4: positive control, lane 5: DNA extracted from the commercial kit, (A) left M: 15,000 bp DNA ladder, right M: 500 bp DNA ladder, (B-D) M: 500 bp DNA ladder. (E-H) Ct values in qRT-PCR for genes of the (E) mutton, (F) pork, (G) duck, (H) chicken.
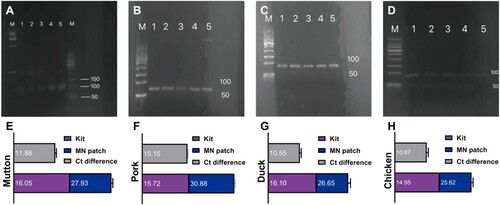
Figure 9. Standard curve for Ct values measured by qRT-PCR for (A) mutton, (B) pork, (C) duck, (D) chicken.
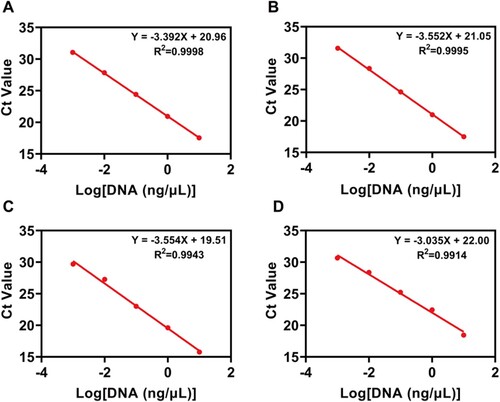
Figure 10. Application of the microneedle patches and commercial kit extraction methods for analysing commercial samples (A-B) Comparison of Ct values of the two detection methods in commercial lamb roll samples.
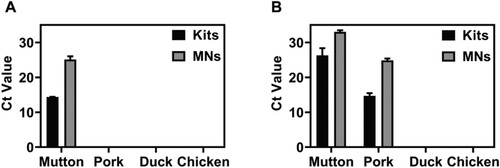
Table 1. Ct value and DNA concentration obtained by two extraction methods (n = 3).