
Figures & data
Figure 1. Structures of paxilline and PAX-CMO hapten.
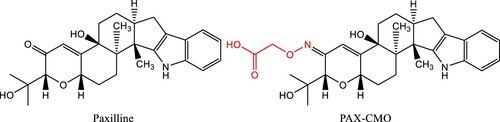
Table 1. The sample pretreatment method used in this research.
Figure 2. (a) MALDI-TOF/MS spectrum of BSA; (b) MALDI-TOF/MS spectrum of PAX-EDC-BSA. The number of modifying groups (11.4) was determined by dividing the mass increase upon modification by the mass added by each modifying group (508.26 Da).
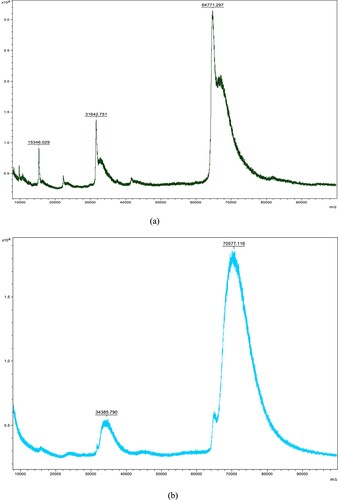
Figure 3. Standard curve for paxilline with 4F8.
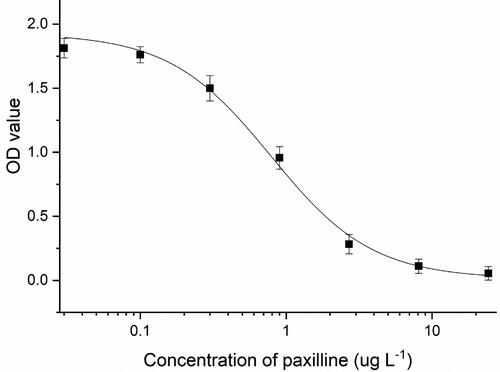
Table 2. icELISA assay parameters of serum and mAb 4F8.
Figure 4. Effects of a pH value of PBS buffer, b ionic strength, c concentration of acetonitrile, and d concentration of methanol on the performance of icELISA (N = 3).
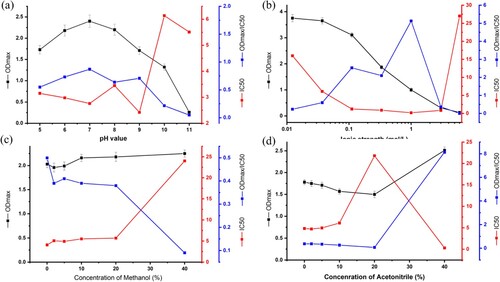
Figure 5. Comparison of different pretreatment methods for maize (a), wheat (b) and barley (c) samples.
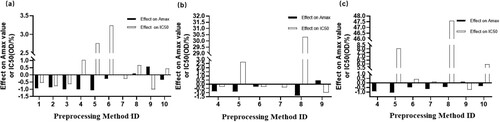
Table 3. Mean recoveries and coefficients of variation of Paxilline in maize, wheat and barley samples (n = 3) MR mean recovery, CV coefficient of variation.