
Figures & data
Table 1. Tomatoes allergenic molecules (Włodarczyk et al., Citation2022).
Table 2. The level of specific IgE to Sola l and Sola l 6 in classes 0, 1, 2, 3, 4 in 100 AD patients (=100%).
Table 3. Sensitivity, specificity and positive predictive value of ALEX2 Allergy Xplorer.
Table 4. The significant relation (p-value <0.05) between the occurrence of clinical reactions to tomatoes, results of specific IgE to Sola l and Sola l 6 (sensitisation) and the results of specific IgE to other molecular components and allergens.
Figure 1. The graph shows the significant relationship between the results of specific IgE to molecular allergen Sola l and the results of specific IgE to other molecular components. Values are the percentage of true positives (blue) and true negatives (orange) within Sola l.
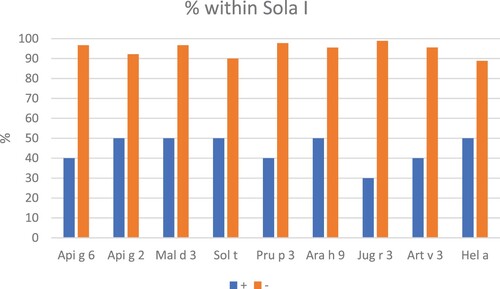
Figure 2. The graph shows the significant relationship between the results of specific IgE to molecular component Sola l 6 and the results of specific IgE to other molecular components. Values are the percentage of true positives (blue) and true negatives (orange) within Sola l 6.
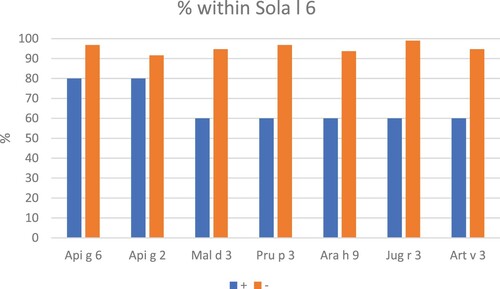
Figure 3. In patient with positive results of specific IgE to Sola l, we show the significant associations with other molecular components. Sensitivity vs 1-specificity plots – curves of parameters.
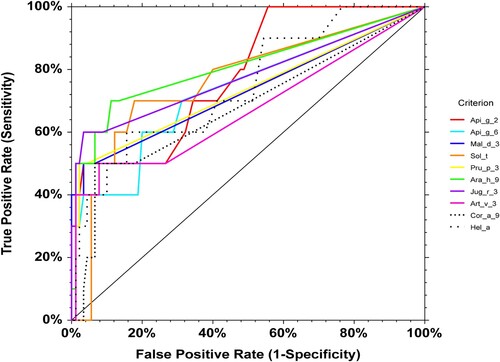
Figure 4. In patient with positive results of specific IgE to Sola l 6, we show the significant associations with other molecular components. Sensitivity vs 1-specificity plots – curves of parameters.
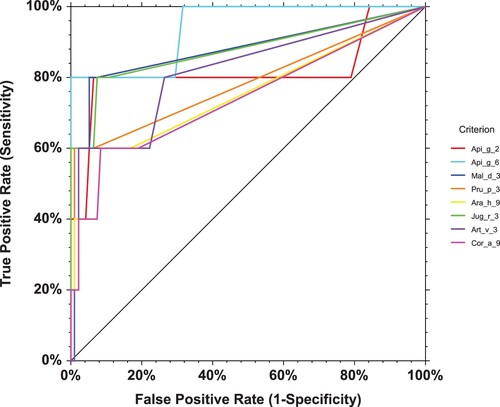
Table 5. In patients with positive results of specific IgE to Sola l, we show empirical AUC (area under the curve) with confidence intervals for each component with a significance level of the AUC = 0.5 test against the alternative that AUC > 0.5.
Table 6. In patients with positive results of specific IgE to Sola l 6, we show empirical AUC (area under the curve) with confidence intervals for each component with a significance level of the AUC = 0.5 test against the alternative that AUC > 0.5.
Table 7. The relation between the occurrence of clinical reaction to tomatoes, positive results of specific IgE to molecular components Sola l and Sola l 6 (sensitisation) and the severity of AD.
Data availability
The datasets generated during and/or analysed during the current study are available from the corresponding author on reasonable request.