
Figures & data
Figure 1. E. hirta leaves extract suppress nitric oxide (NO) production in LPS-induced RAW 264.7. A. The effects of E. hirta leaves extract on the induction of NO production. B. The cell viability of (A) assesed by WST assay. The RAW 264.7 cells were treated with LPS and/or extracts for 24 h. The NO levels in the medium and WST-1 were measured in triplicate (n = 3) and are shown as a means ± standard deviation (SD). * P < 0.05 and ** P < 0.01 versus LPS alone.
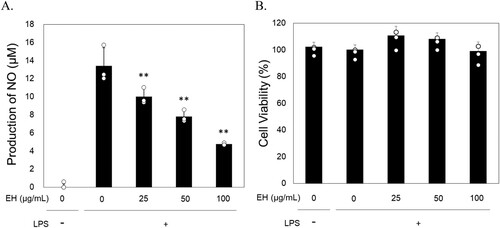
Table 1. The potency of E. hirta leaves extract in inhibiting NO.
Figure 2. The effects of EH leaves extract on the induction of iNOS protein and pro-inflammatory cytokines. The RAW 264.7 cells were treated with LPS and/or extracts for 24 h. The iNOS protein level was measured by flowcytometri and then the histogram image was visualized with FlowJo software. The red line separates cells that positively express the target protein. Peaks to the left of the red line are cells that do not express the target protein, while those to the right of the red line are peaks of cells that positively express the target protein.
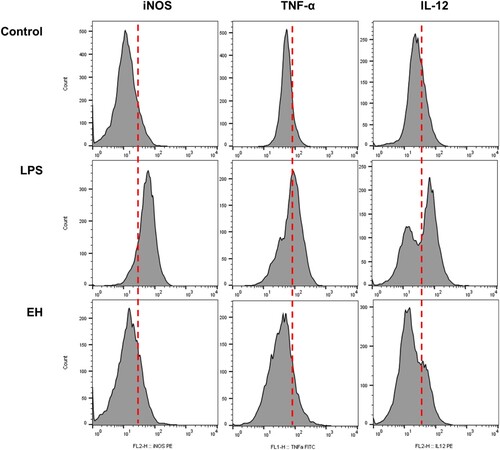
Figure 3. The extract of EH suppress the expression level of iNOS protein (A) and pro-inflammatory cytokines TNF-α and IL-12 (B). The RAW 264.7 cells were treated with LPS and/or extracts for 24 h. The pro-inflammatory cytokines TNF-α and IL-12 level were measured by flow cytometri in quadruplicate (n = 4). Data are shown as a means ± standard deviation (SD). # P < 0.05 and ## P < 0.01 versus control; * P < 0.05 and ** P < 0.01 versus LPS alone.
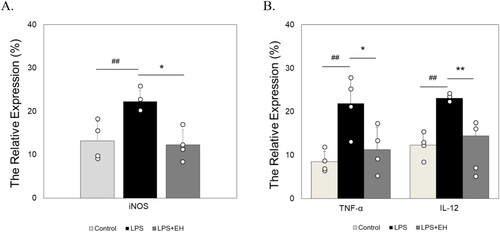
Figure 4. Gene expression profile of RAW cells due to administration of IC50 dose of extract. (A) Heatmap, (B) volcano plot
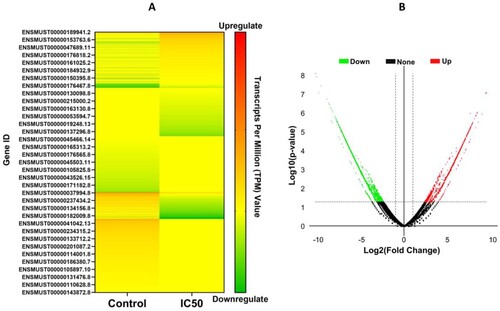
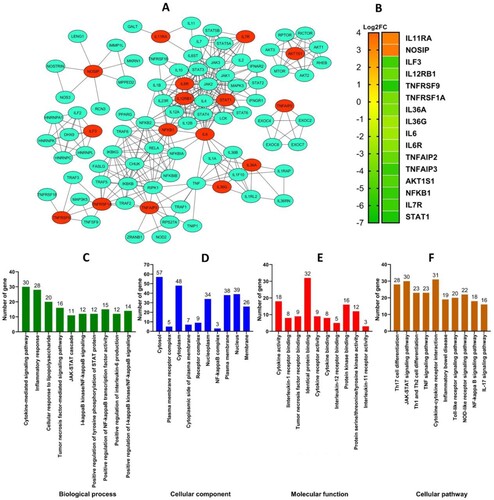
Figure 5. PPI network based on proteins that experience changes in expression due to extract administration and functional annotation analysis. (A) PPI networks, red color indicates the proteins that experienced changes in expression due to the administration of EH extract. (B) Changes in the expression of inflammation-related proteins. (C-F) Functional annotation based on PPI network.
Data availability statement
The data that support the findings of this study are available from the corresponding author, [NW], upon reasonable request.